Fig. 16
Download original image
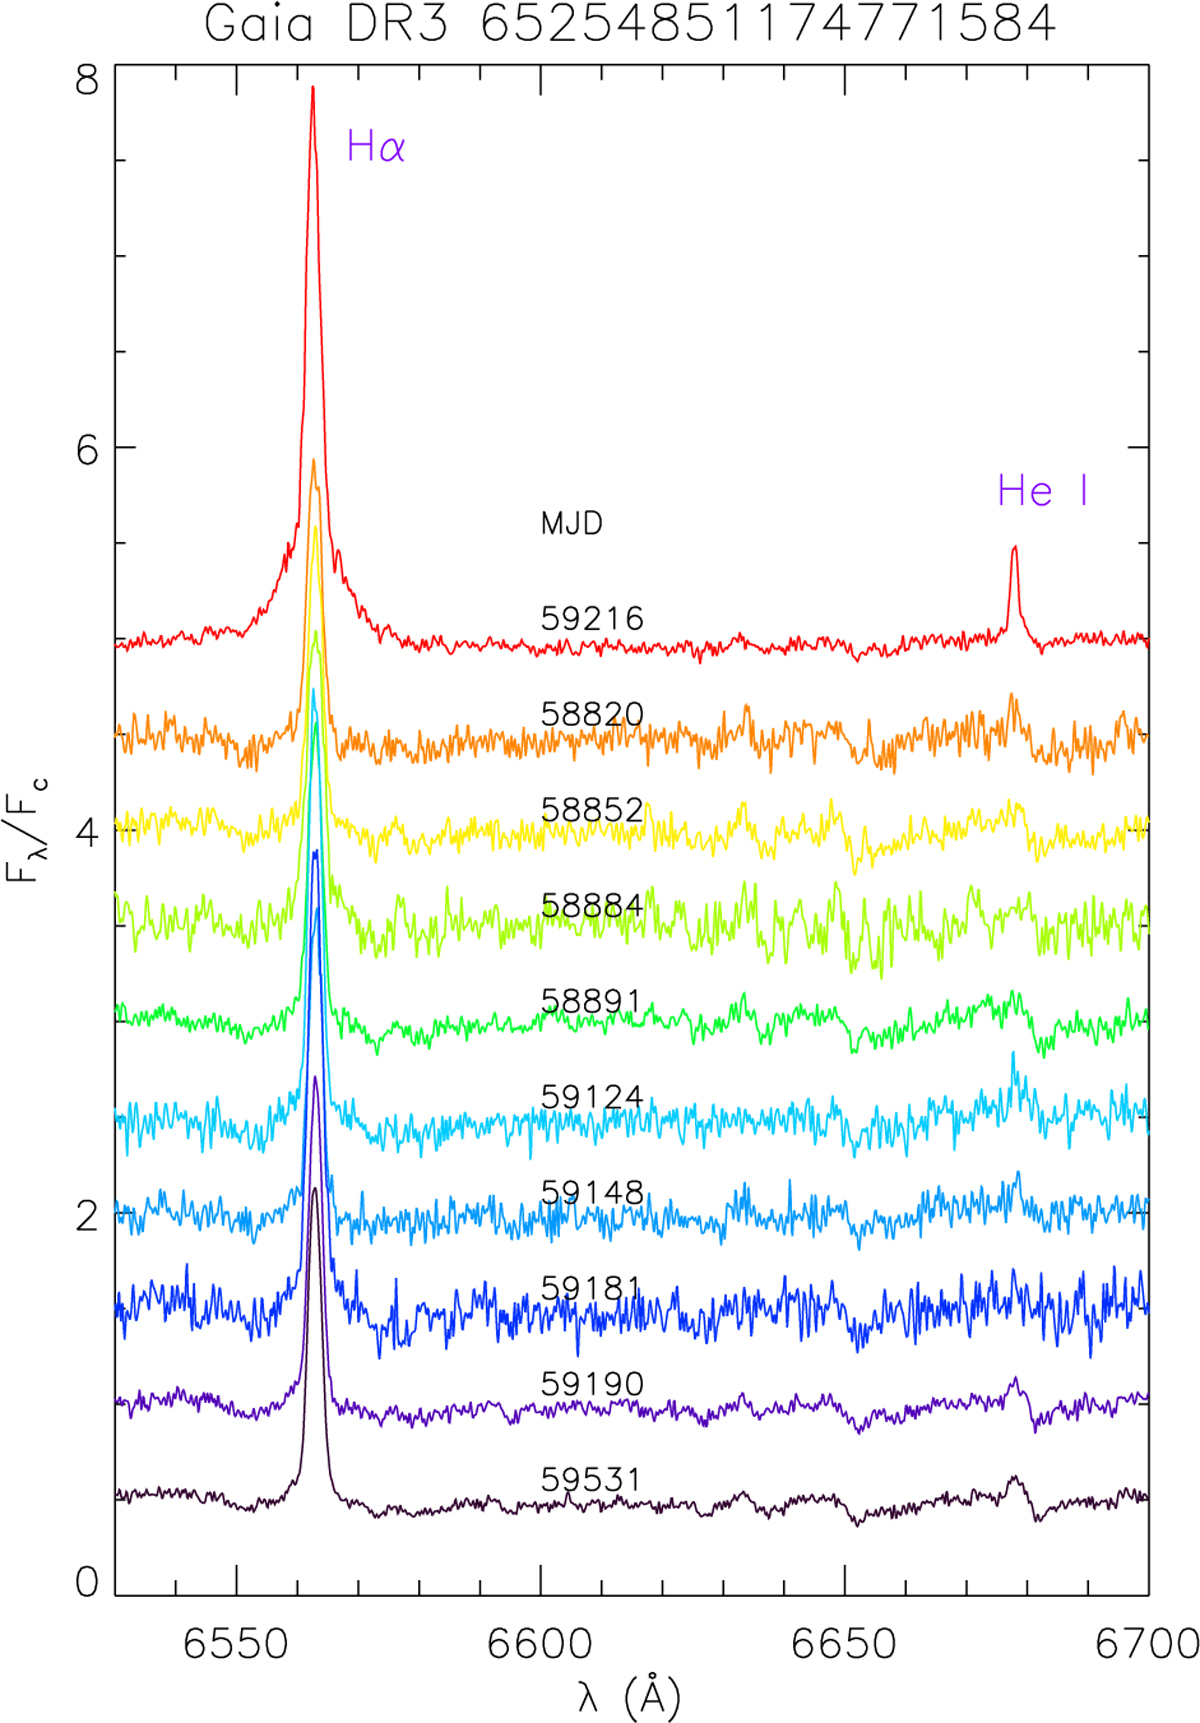
LAMOST MRS photospheric-subtracted spectra of LO Tau in the spectral region containing the Hα and He I λ6678 Å line. The spectra have been sorted in time order from top to bottom (except for the uppermost one) and have been vertically shifted for clarity. The modified Julian day (MJD) is written next to the spectrum. The uppermost spectrum plotted with a red line displays a very strong and broad Hα profile as well as the He I line in emission, which is indicative of a flare event.
Current usage metrics show cumulative count of Article Views (full-text article views including HTML views, PDF and ePub downloads, according to the available data) and Abstracts Views on Vision4Press platform.
Data correspond to usage on the plateform after 2015. The current usage metrics is available 48-96 hours after online publication and is updated daily on week days.
Initial download of the metrics may take a while.