Fig. 13
Download original image
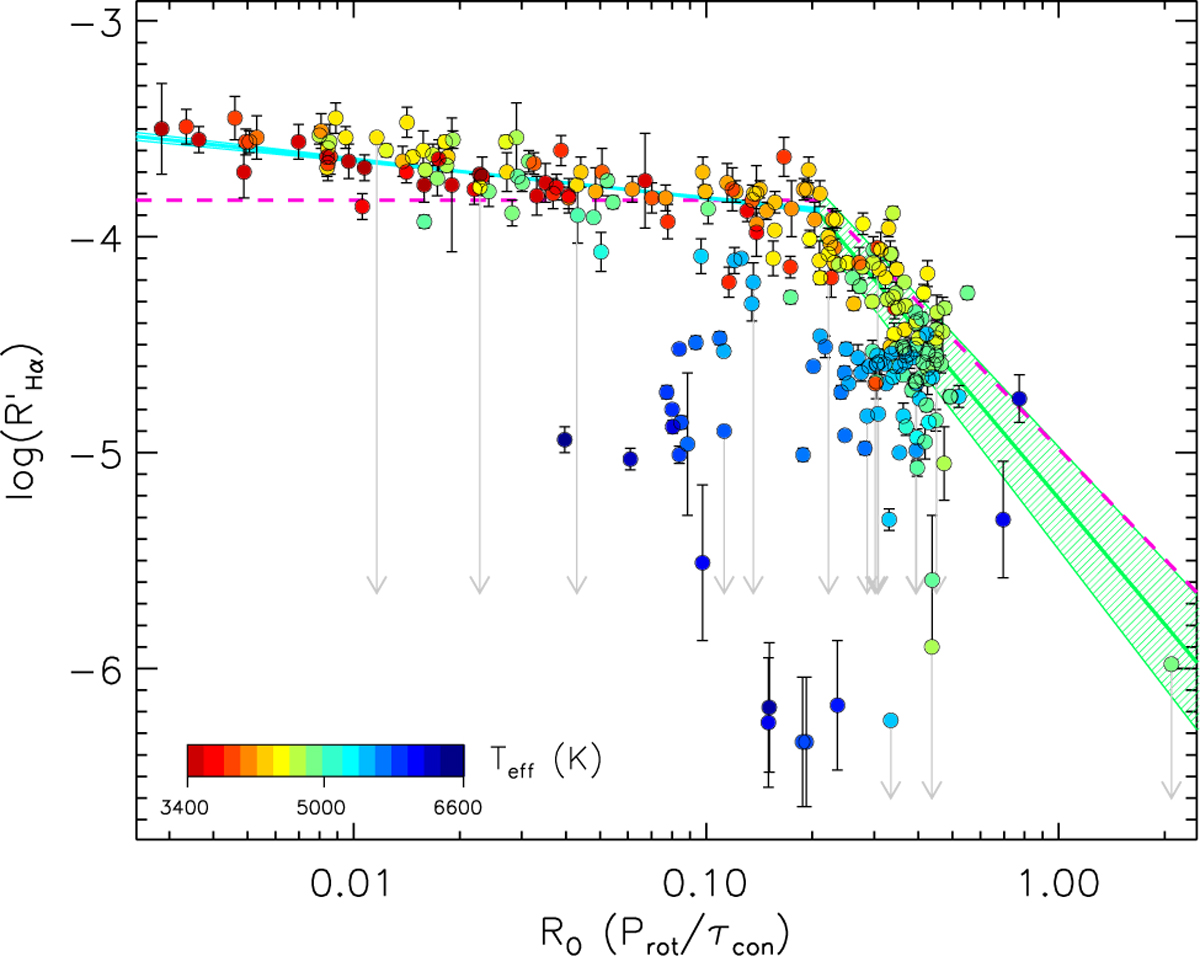
![]() versus the Rossby number RO. The symbols are color coded by Teff. Upper limits are highlighted with downward gray arrows. The magenta dashed line denotes the relation of Newton et al. (2017), while the cyan full line (slope = −0.18 ± 0.02) is our best fit to the cold stars (Teff ≤ 4500 K) in the saturated activity domain (RO < 0.21). The power law with slope −1.9 ± 0.2 we found for the stars with RO ≥ 0.21 is shown with a green line. The 1σ errors are indicated by the hatched regions.
versus the Rossby number RO. The symbols are color coded by Teff. Upper limits are highlighted with downward gray arrows. The magenta dashed line denotes the relation of Newton et al. (2017), while the cyan full line (slope = −0.18 ± 0.02) is our best fit to the cold stars (Teff ≤ 4500 K) in the saturated activity domain (RO < 0.21). The power law with slope −1.9 ± 0.2 we found for the stars with RO ≥ 0.21 is shown with a green line. The 1σ errors are indicated by the hatched regions.
Current usage metrics show cumulative count of Article Views (full-text article views including HTML views, PDF and ePub downloads, according to the available data) and Abstracts Views on Vision4Press platform.
Data correspond to usage on the plateform after 2015. The current usage metrics is available 48-96 hours after online publication and is updated daily on week days.
Initial download of the metrics may take a while.