Fig. 12
Download original image
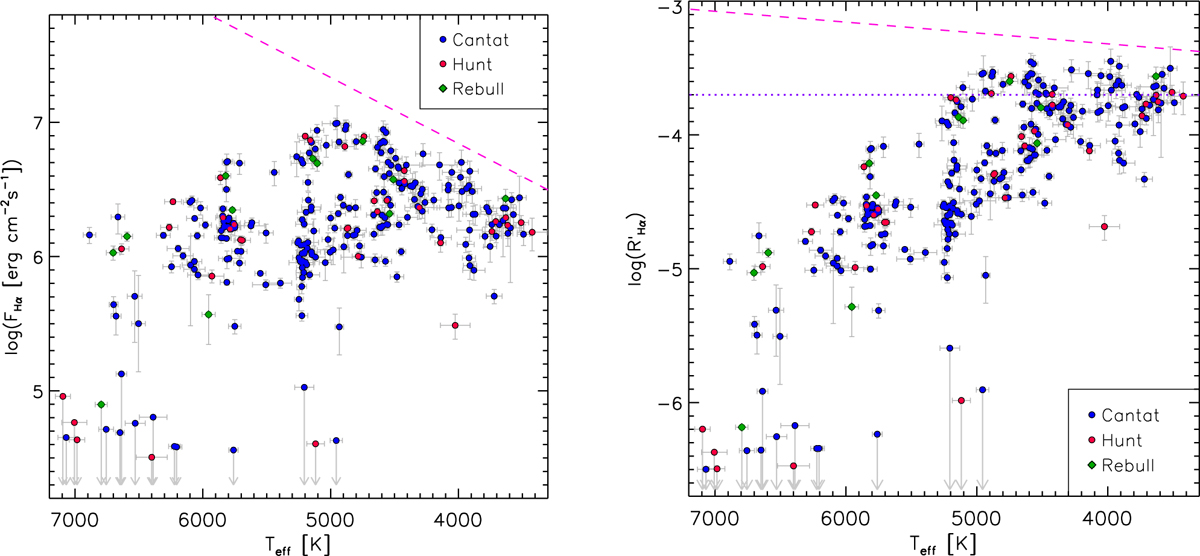
Activity indicators. Left panel: Hα flux versus Teff. Right panel: ![]() versus Teff. The three subsamples are distinguished with different symbols, as indicated in the legend. Upper limits are indicated by downward arrows. The straight dashed line in each panel is the boundary between chromospheric emission (below) and accretion as derived by Frasca et al. (2015). The dotted line in the
versus Teff. The three subsamples are distinguished with different symbols, as indicated in the legend. Upper limits are indicated by downward arrows. The straight dashed line in each panel is the boundary between chromospheric emission (below) and accretion as derived by Frasca et al. (2015). The dotted line in the ![]() plot marks the saturation level log(
plot marks the saturation level log(![]() ) = −3.7 estimated by Fang et al. (2018).
) = −3.7 estimated by Fang et al. (2018).
Current usage metrics show cumulative count of Article Views (full-text article views including HTML views, PDF and ePub downloads, according to the available data) and Abstracts Views on Vision4Press platform.
Data correspond to usage on the plateform after 2015. The current usage metrics is available 48-96 hours after online publication and is updated daily on week days.
Initial download of the metrics may take a while.