Fig. 11
Download original image
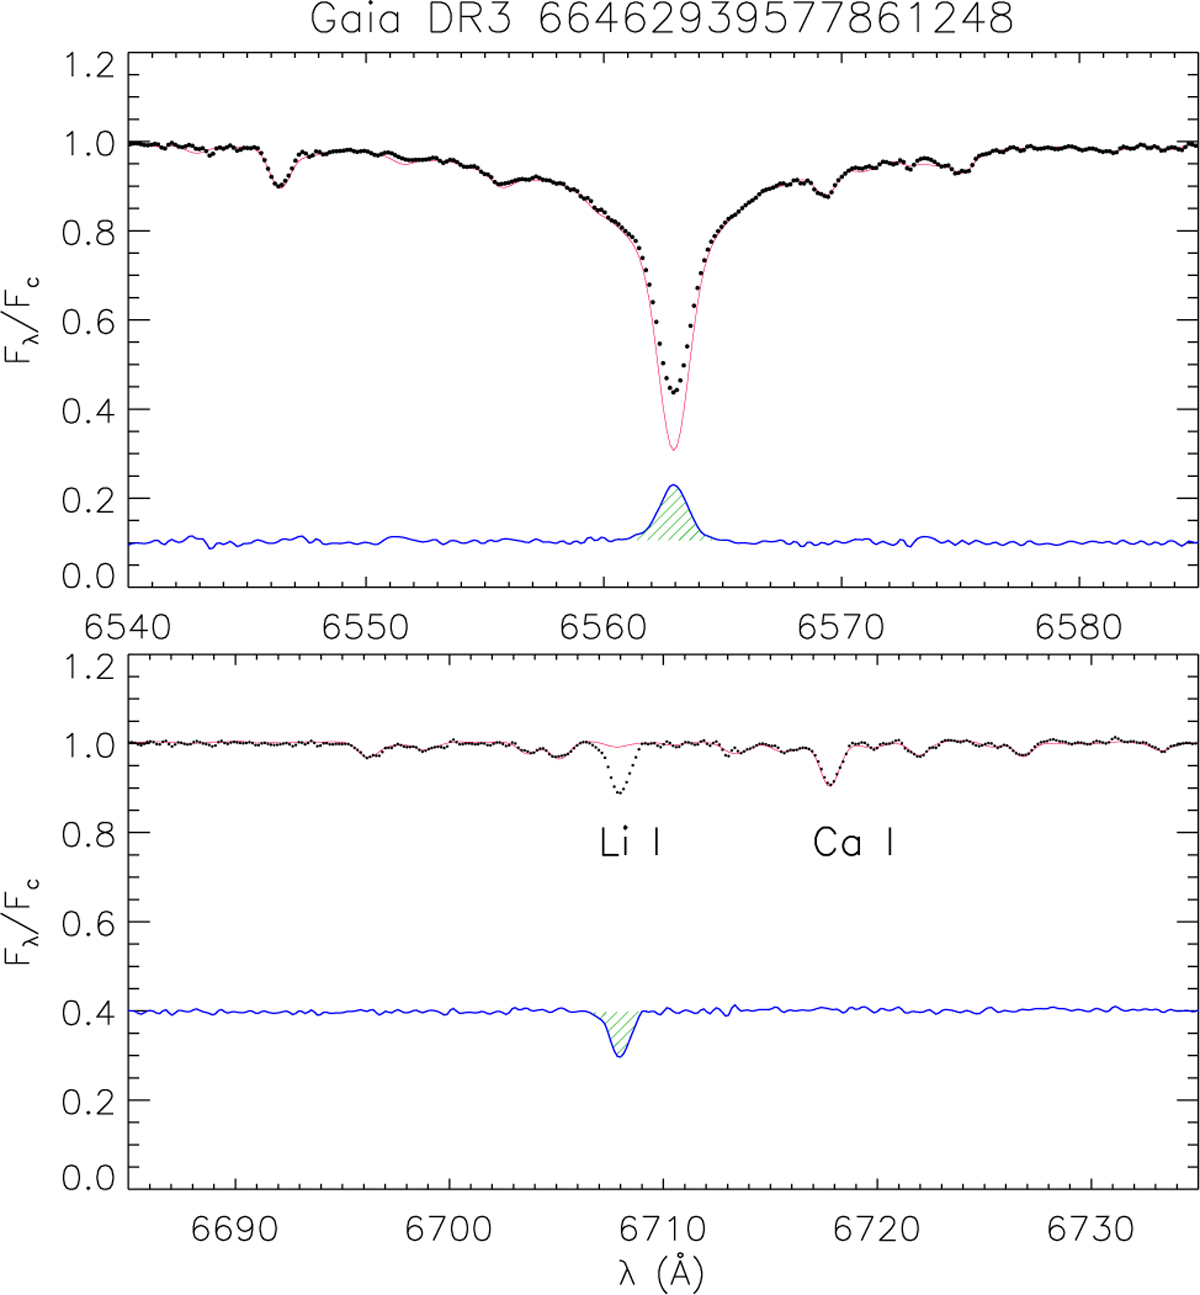
Example of the subtraction of the best non-active, lithiumpoor template (red line) from the spectrum of the F9-type star Gaia-DR3 66462939577861248 = TIC 35205639 = HII 2786 (black dots) in the Hα (top panel) and Li I λ6708 Å (bottom panel) spectral regions. The difference spectrum (blue line), whose continuum has been arbitrarily shifted for clarity, reveals the chromospheric emission in the Hα core and emphasizes the lithium line, removing the blended photospheric lines. The green hatched areas represent the excess Hα emission and Li I absorption that were integrated to obtain ![]() and WLi, respectively.
and WLi, respectively.
Current usage metrics show cumulative count of Article Views (full-text article views including HTML views, PDF and ePub downloads, according to the available data) and Abstracts Views on Vision4Press platform.
Data correspond to usage on the plateform after 2015. The current usage metrics is available 48-96 hours after online publication and is updated daily on week days.
Initial download of the metrics may take a while.