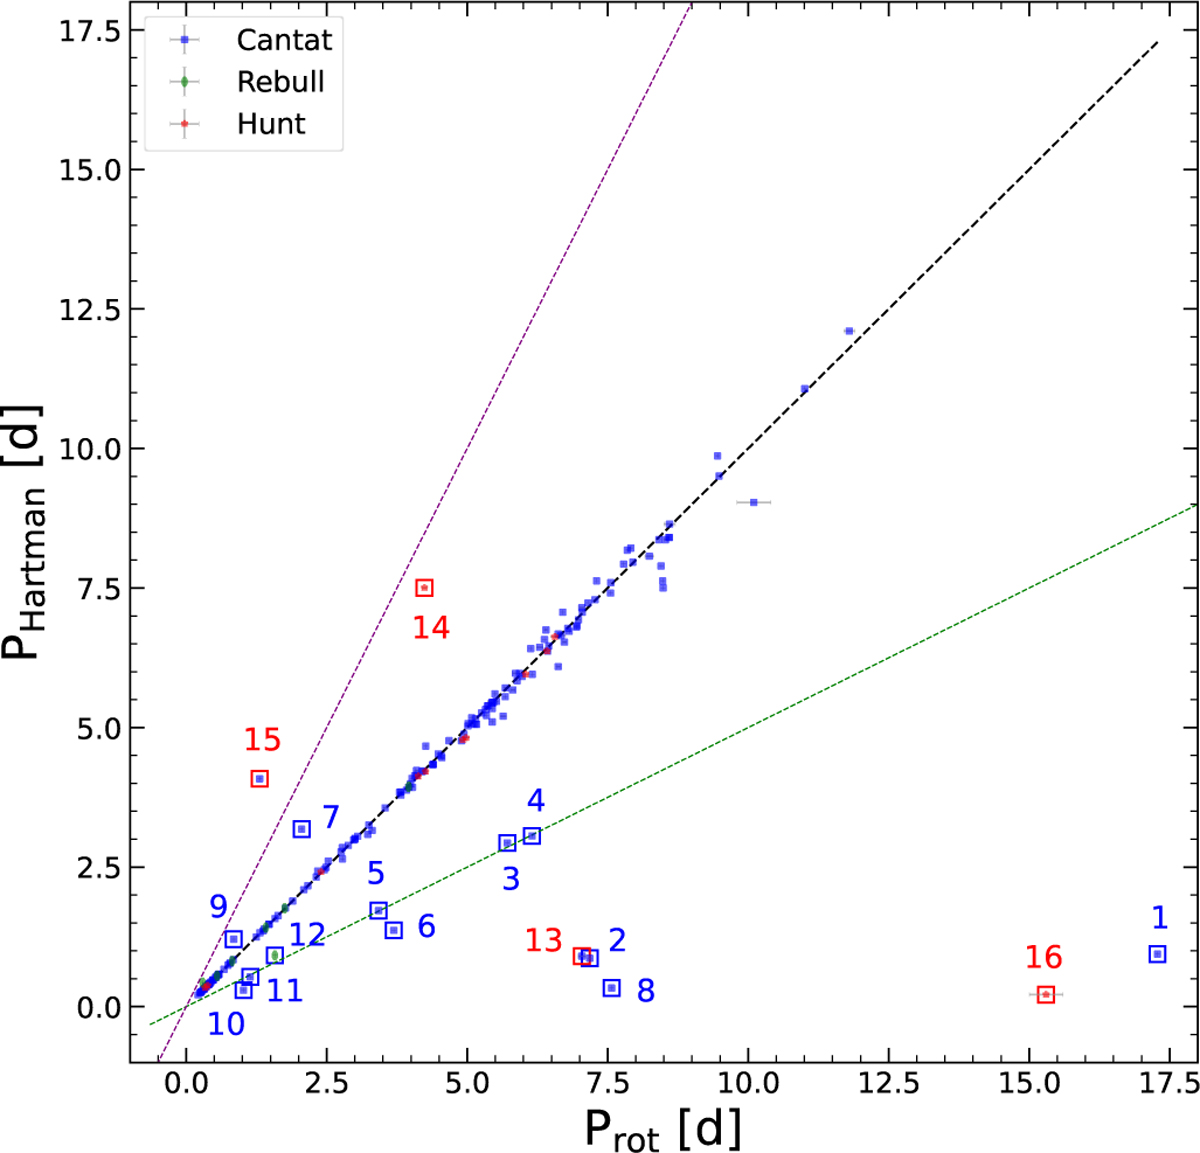
Fig. 10
Download original image
Comparison between the Prot values adopted in this work (from K2 or TESS) and those published by Hartman et al. (2010). The color of symbols distinguishes the three subsamples as indicated in the legend. The one-to-one relation is shown by the black dashed line. The green and purple dotted lines with slopes of 0.5 and 2, respectively, are also shown. The most discrepant stars are enclosed into squares in blue (for Prot reported in Rebull et al. 2016) and red (for Prot values derived in this work from TESS data).
Current usage metrics show cumulative count of Article Views (full-text article views including HTML views, PDF and ePub downloads, according to the available data) and Abstracts Views on Vision4Press platform.
Data correspond to usage on the plateform after 2015. The current usage metrics is available 48-96 hours after online publication and is updated daily on week days.
Initial download of the metrics may take a while.