Fig. 3
Download original image
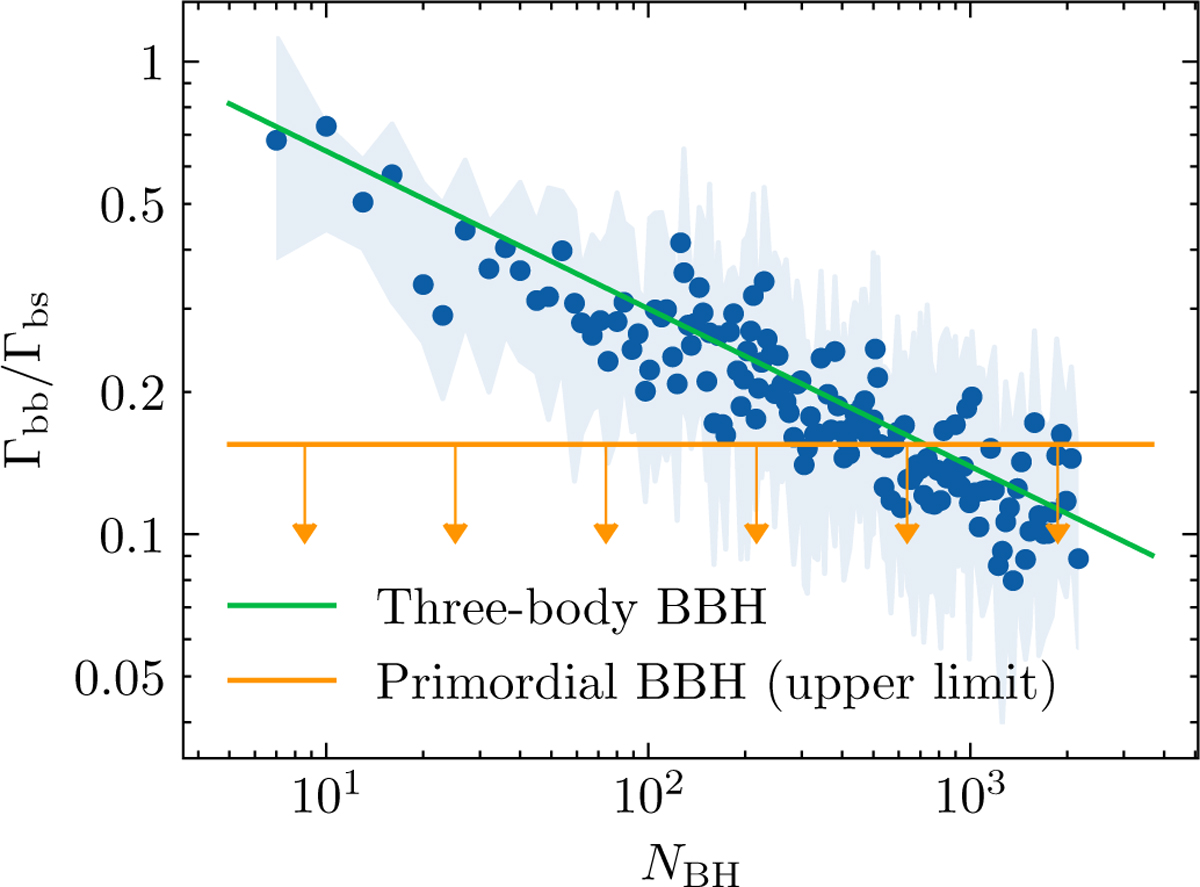
Ratio of the BBH − BBH interaction rate and the binary-single interaction rate as a function of the cluster’s number of BHs at the time the interactions took place. The blue dots correspond to the median values obtained from the CMC models (contour is the 64% region). In green, the analytical prediction of Eq. (6), which considers the interaction of three-body BBHs ; yellow is the naïve prediction of Eq. (7), which only considers the interactions of primordial binaries.
Current usage metrics show cumulative count of Article Views (full-text article views including HTML views, PDF and ePub downloads, according to the available data) and Abstracts Views on Vision4Press platform.
Data correspond to usage on the plateform after 2015. The current usage metrics is available 48-96 hours after online publication and is updated daily on week days.
Initial download of the metrics may take a while.