Fig. 3
Download original image
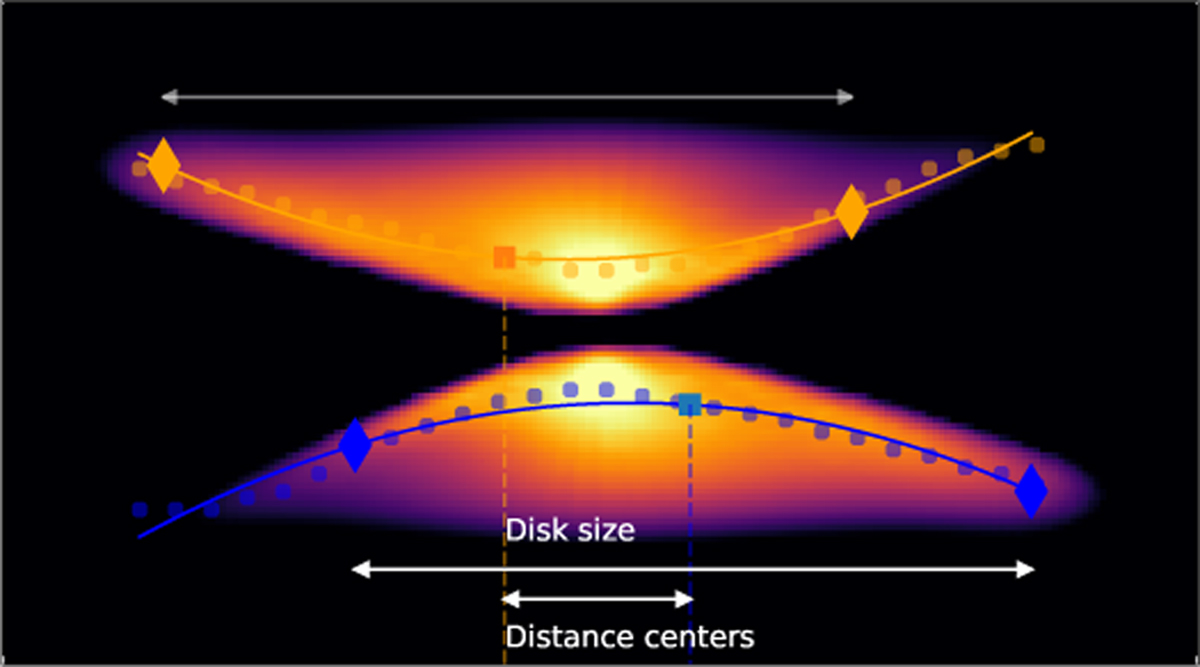
Schematic representation of the spine fitting. The light circles show the location of the maxima after a high-order polynomial fit of the minor-axis profiles. The solid lines represent the final spines after fitting the maxima by a polynomial of order 2. The diamond represent the locations where the flux reaches 10% with respect to the maximum of the spine, and the squares are the center of the spine (i.e., the mid-point of these two points). The lateral asymmetry is the ratio between the distance of the centers to averaged disk size.
Current usage metrics show cumulative count of Article Views (full-text article views including HTML views, PDF and ePub downloads, according to the available data) and Abstracts Views on Vision4Press platform.
Data correspond to usage on the plateform after 2015. The current usage metrics is available 48-96 hours after online publication and is updated daily on week days.
Initial download of the metrics may take a while.