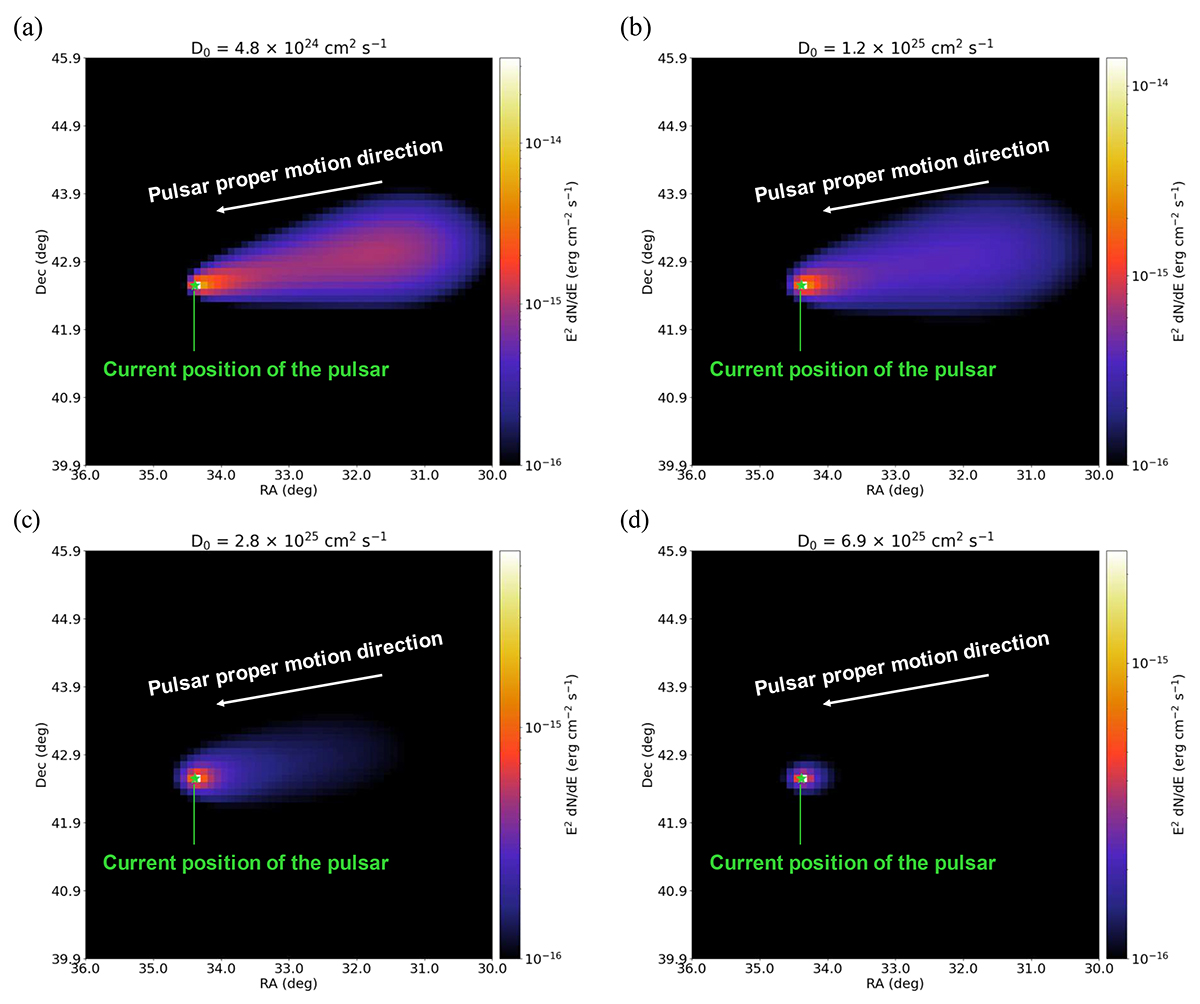
Fig. 6.
Download original image
Results of γ-ray flux intensity map at 50 TeV generated for different values of D0. Panels (a)–(d) give the results for D0 = 4.8 × 1024 cm2 s−1, 1.2 × 1025 cm2 s−1, 2.8 × 1025 cm2 s−1, and 6.9 × 1025 cm2 s−1, respectively. For comparing with the physical image shown in the LHAASO catalog, the coordinate system used here is the J2000 equatorial frame. The other parameters adopted in the calculation are d = 0.4 kpc and v = 1600 km s−1. The white arrow indicates the proper motion direction of the pulsar, while the green star marks the current position of the pulsar.
Current usage metrics show cumulative count of Article Views (full-text article views including HTML views, PDF and ePub downloads, according to the available data) and Abstracts Views on Vision4Press platform.
Data correspond to usage on the plateform after 2015. The current usage metrics is available 48-96 hours after online publication and is updated daily on week days.
Initial download of the metrics may take a while.