Fig. 7
Download original image
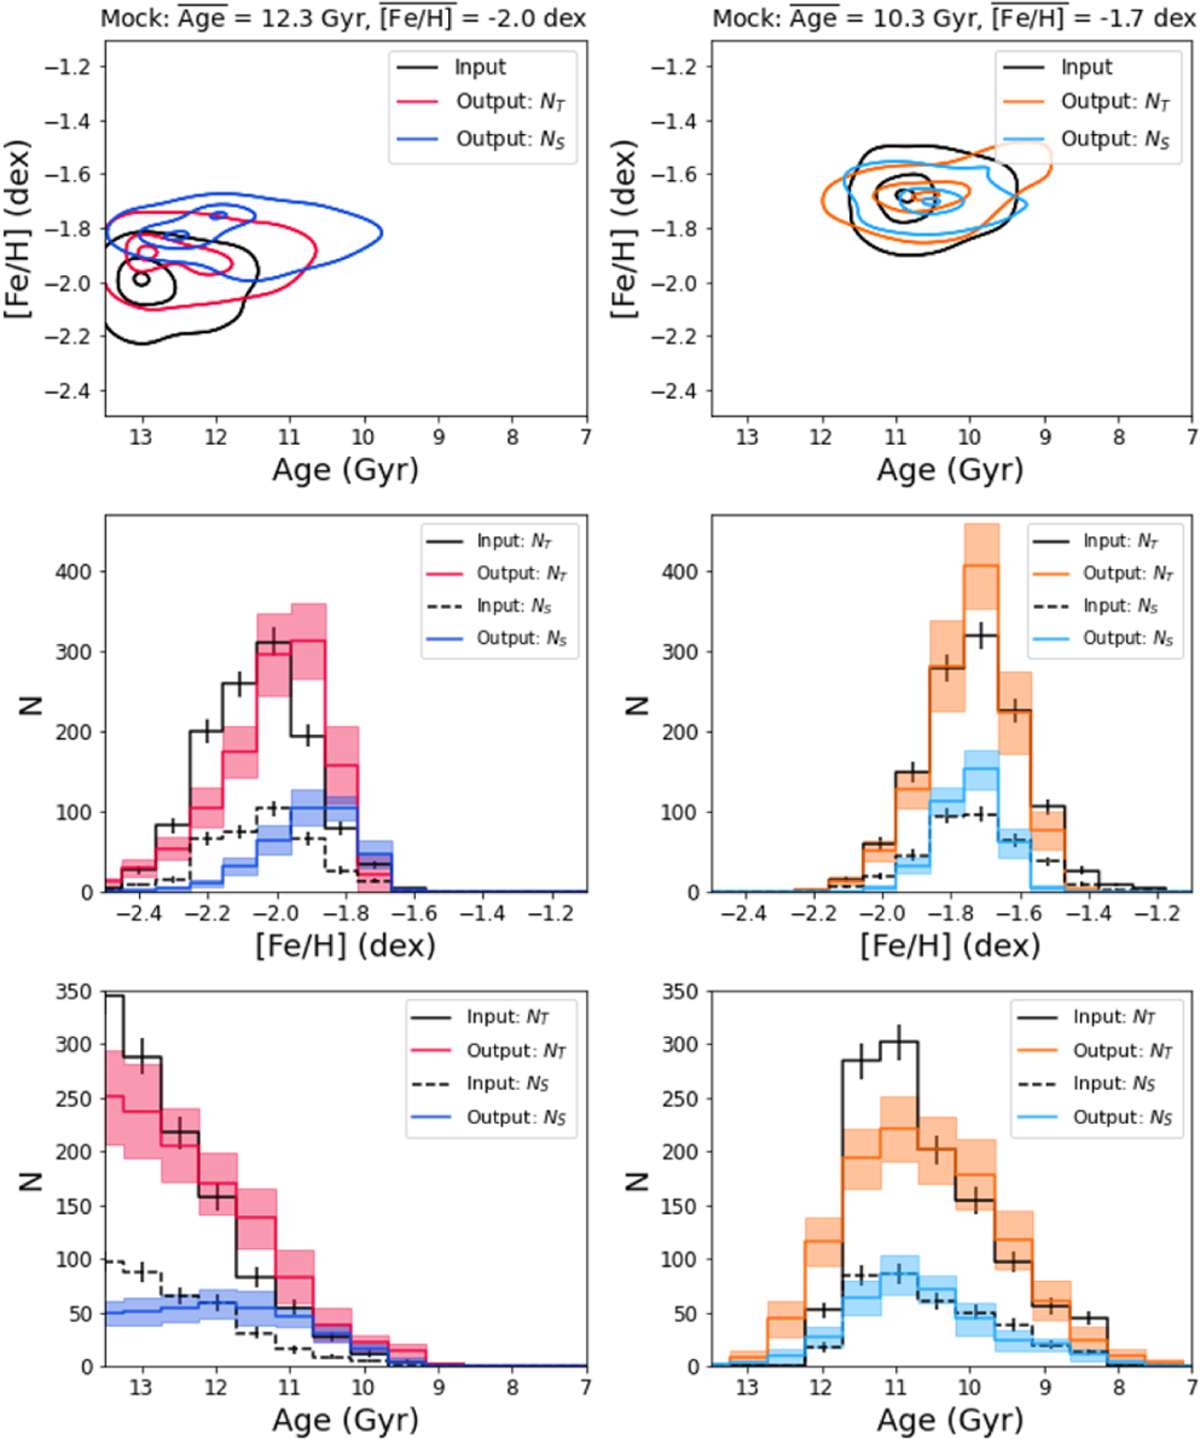
Age and metallicity distributions of the input mocks (black) compared to the output of DirSFH. The first column shows the old and metal-poor mock peaking at 12.3 Gyr and −2.0 dex, with blue being the smaller sample (NS stars) than red (NT stars). The second column shows the younger, slightly more metal-rich mock (mean age of 10.3 Gyr and [Fe/H] of −1.7 dex) with blue corresponding to the smaller sample of size NS and orange the larger sample of NT stars. The top row shows the contours of the 2D distributions containing the percentage of stars within 1,2 and 3σ levels in 2D. The middle row shows the 1D metallicity distributions and the bottom row the age distributions, where the errors come from averaging over the 100 solutions produced by DirSFH. In the bottom two rows, the input for the samples of size NS are shown with dashed lines to distinguish between distributions. Errors on the input distributions, plotted as black error bars, are taken as ![]() per bin.
per bin.
Current usage metrics show cumulative count of Article Views (full-text article views including HTML views, PDF and ePub downloads, according to the available data) and Abstracts Views on Vision4Press platform.
Data correspond to usage on the plateform after 2015. The current usage metrics is available 48-96 hours after online publication and is updated daily on week days.
Initial download of the metrics may take a while.