Fig. 16
Download original image
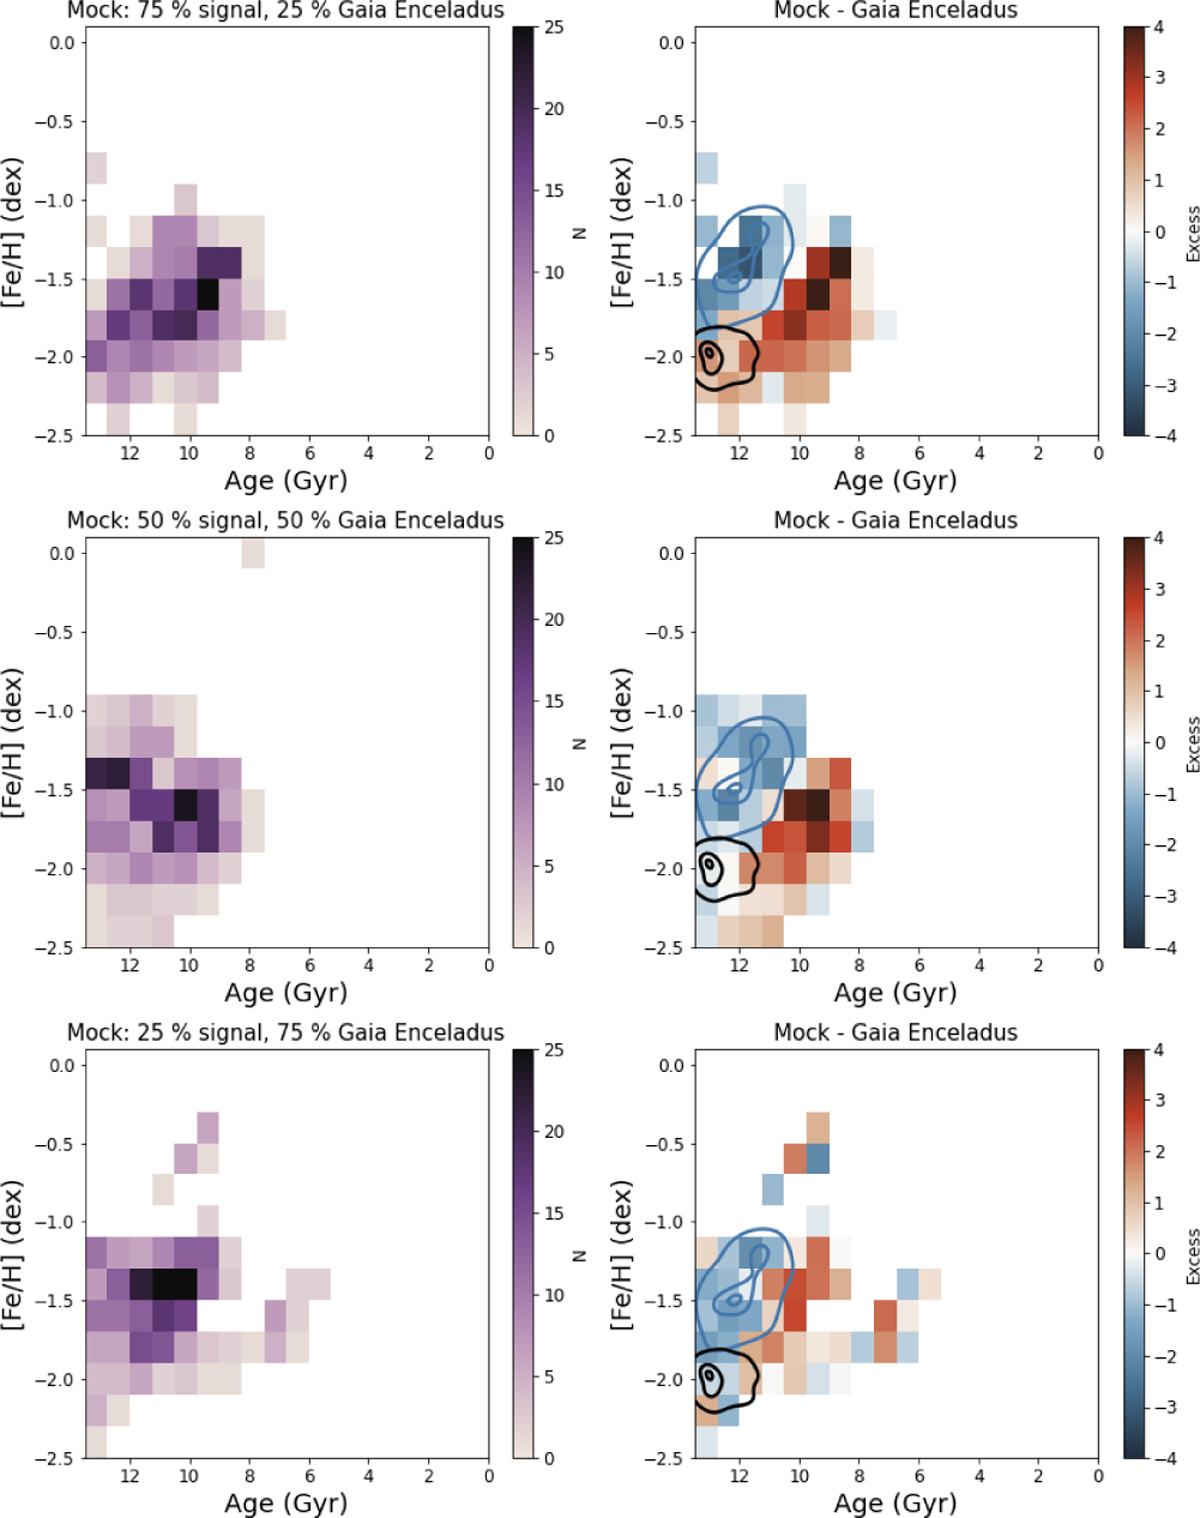
Mocks of an old, metal-poor signal with contamination from Gaia Enceladus. The top, middle, and bottom rows correspond to the mock with 25%, 50%, and 75% of the stars coming from the old, metal-poor signal and the rest from contamination. In all cases, the total number of stars is NS. The first column shows the outputted age-metallicity distribution from DirSFH and the second column shows this minus the observed Gaia Enceladus age-metallicity distribution. The contours show the observed GE distribution (blue) and the black shows the input age-metallicity distribution for the old-metal poor signal.
Current usage metrics show cumulative count of Article Views (full-text article views including HTML views, PDF and ePub downloads, according to the available data) and Abstracts Views on Vision4Press platform.
Data correspond to usage on the plateform after 2015. The current usage metrics is available 48-96 hours after online publication and is updated daily on week days.
Initial download of the metrics may take a while.