Fig. 15
Download original image
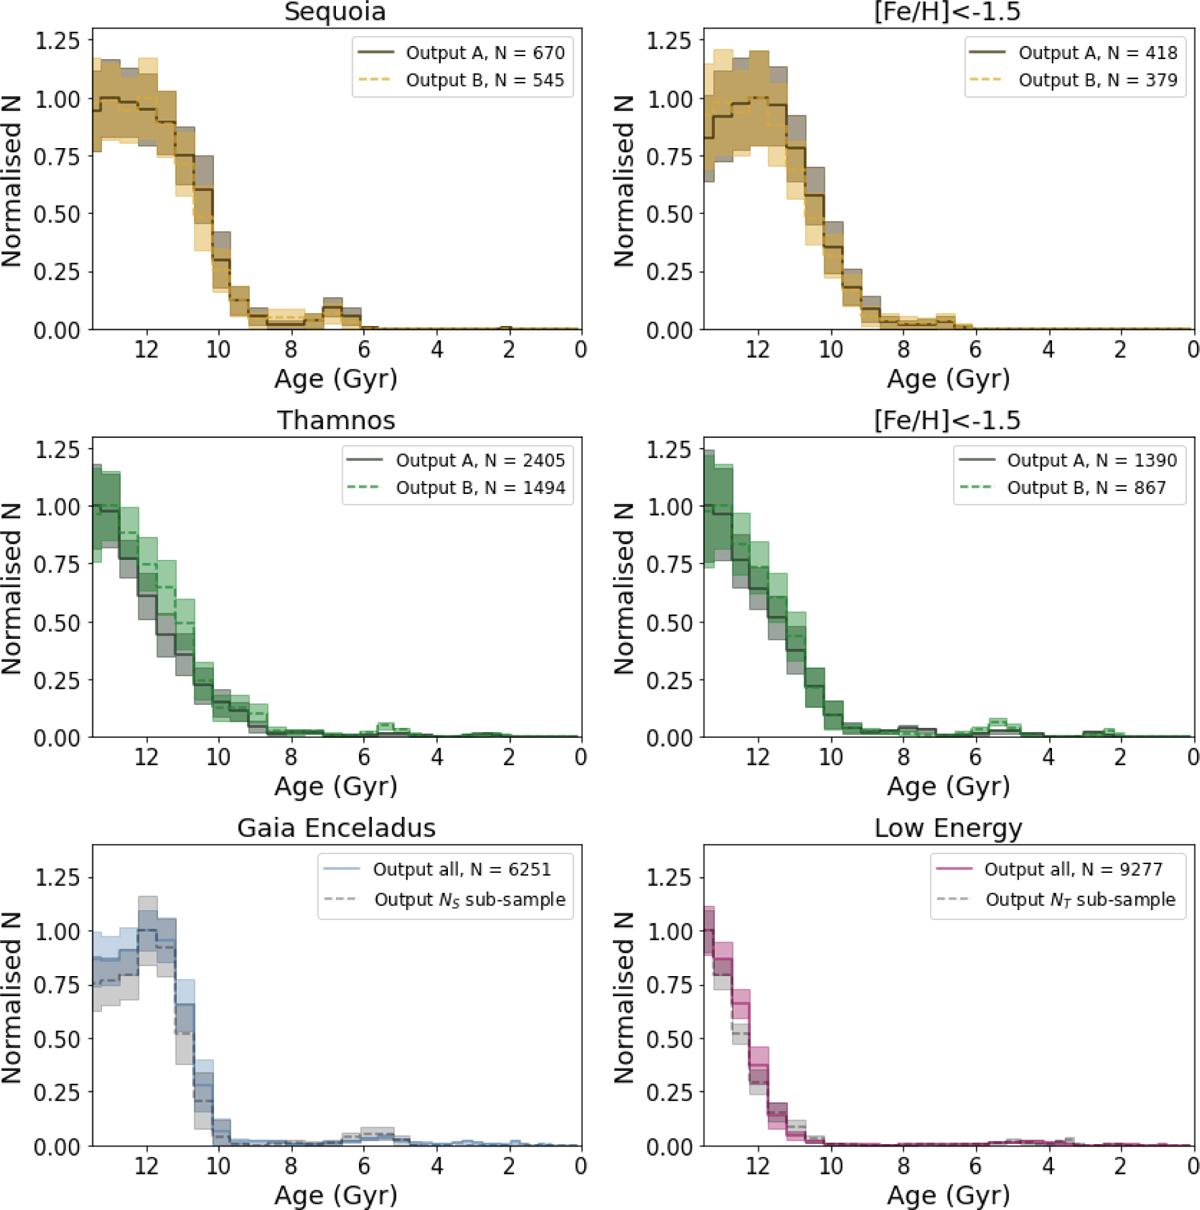
Age distributions of the different samples. The line shows the weighted mean count per age bin and the shading indicates 1σ across 100 iterations. For the first two rows, Sequoia A (B) and Thamnos A (B) are shown with dashed (solid) lines. The left panels of these first two rows show all stars in the Sequoia and Thamnos best fit CMDs, and the right panels show only stars below a [Fe/H] threshold of −1.5 dex. The bottom row shows all stars in the GE and LE samples for comparison and one random NT sub-sample.
Current usage metrics show cumulative count of Article Views (full-text article views including HTML views, PDF and ePub downloads, according to the available data) and Abstracts Views on Vision4Press platform.
Data correspond to usage on the plateform after 2015. The current usage metrics is available 48-96 hours after online publication and is updated daily on week days.
Initial download of the metrics may take a while.