Fig. 14
Download original image
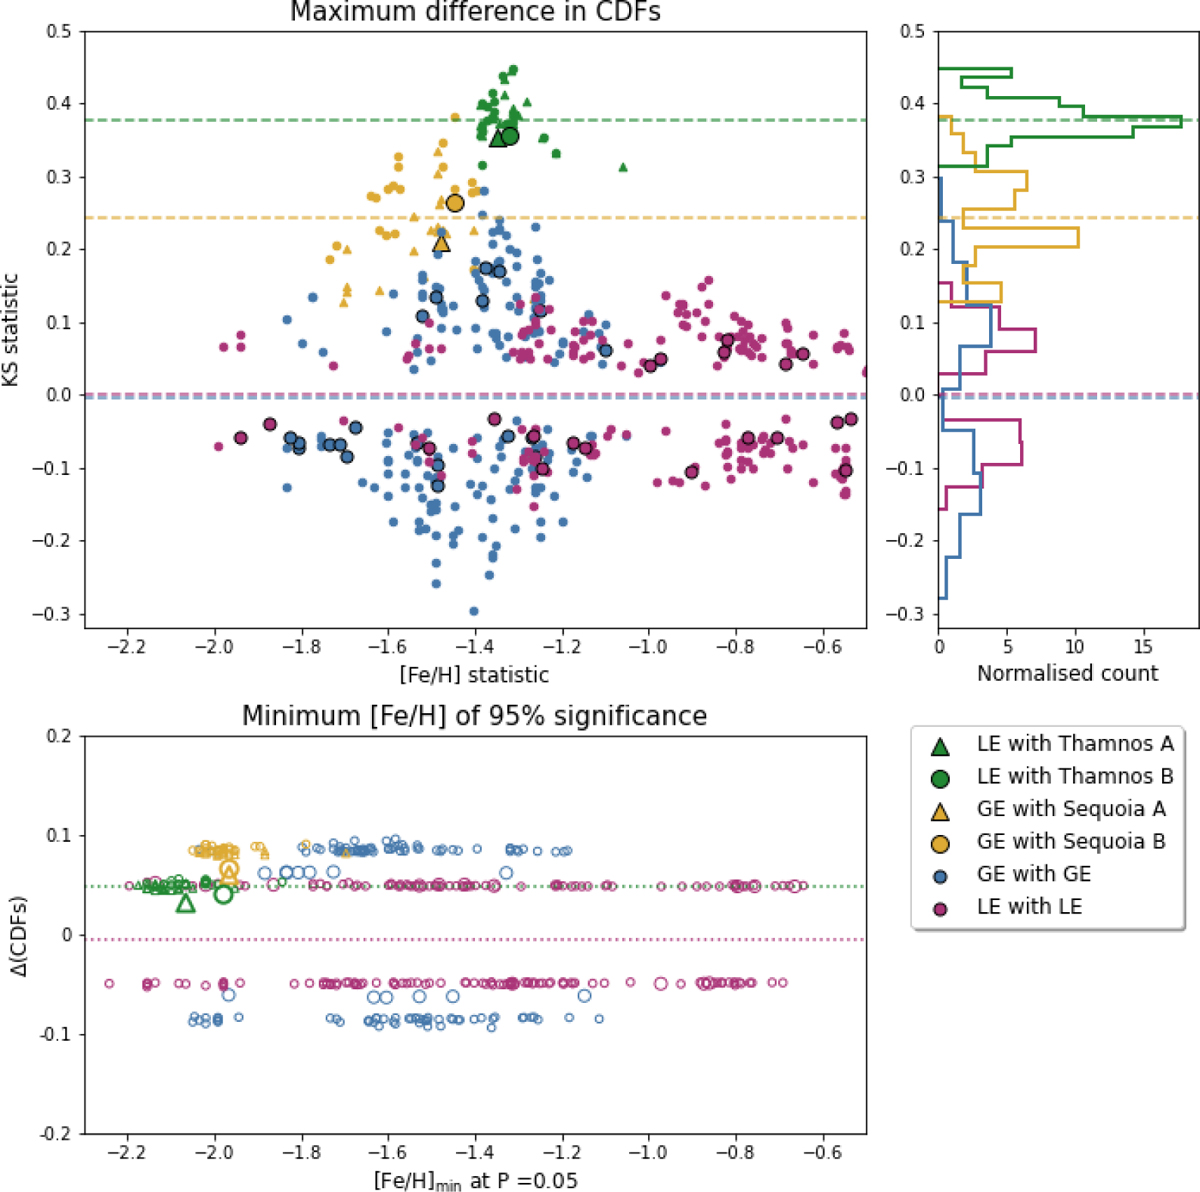
Top-left panel: KS statistic (maximum difference) and metallicity of the maximum difference for the comparison of best fit CMD metallicity distributions of various samples. Yellow and green points represent Sequoia and Thamnos samples compared with GE and LE samples, respectively. Large markers represent the comparison of Thamnos/Sequoia A (triangle) with LE and GE and Thamnos and Sequoia B (circle) with LE/GE. Small markers represent the same but with the sub-samples. Blue points show the GE metallicities compared with one another. Pink points show the LE metallicities compared with one another. Large circle markers represent the 20 sub-samples compared with the parent GE/LE and small markers the 20 sub-samples compared with one another. The dashed green (yellow) line represents the mean maximum difference for Thamnos (Sequoia) samples with LE (GE). Top-right panel: projected distribution of the KS statistics, highlighting the differences between sub-samples and true differences in the case of Sequoia (yellow) and Thamnos (green). Bottom panel: [Fe/H] at which the difference in the cumulative metallicity distributions of various sub-samples becomes significant to the 95% level. The same colours and markers are used for the different samples.
Current usage metrics show cumulative count of Article Views (full-text article views including HTML views, PDF and ePub downloads, according to the available data) and Abstracts Views on Vision4Press platform.
Data correspond to usage on the plateform after 2015. The current usage metrics is available 48-96 hours after online publication and is updated daily on week days.
Initial download of the metrics may take a while.