Fig. 13
Download original image
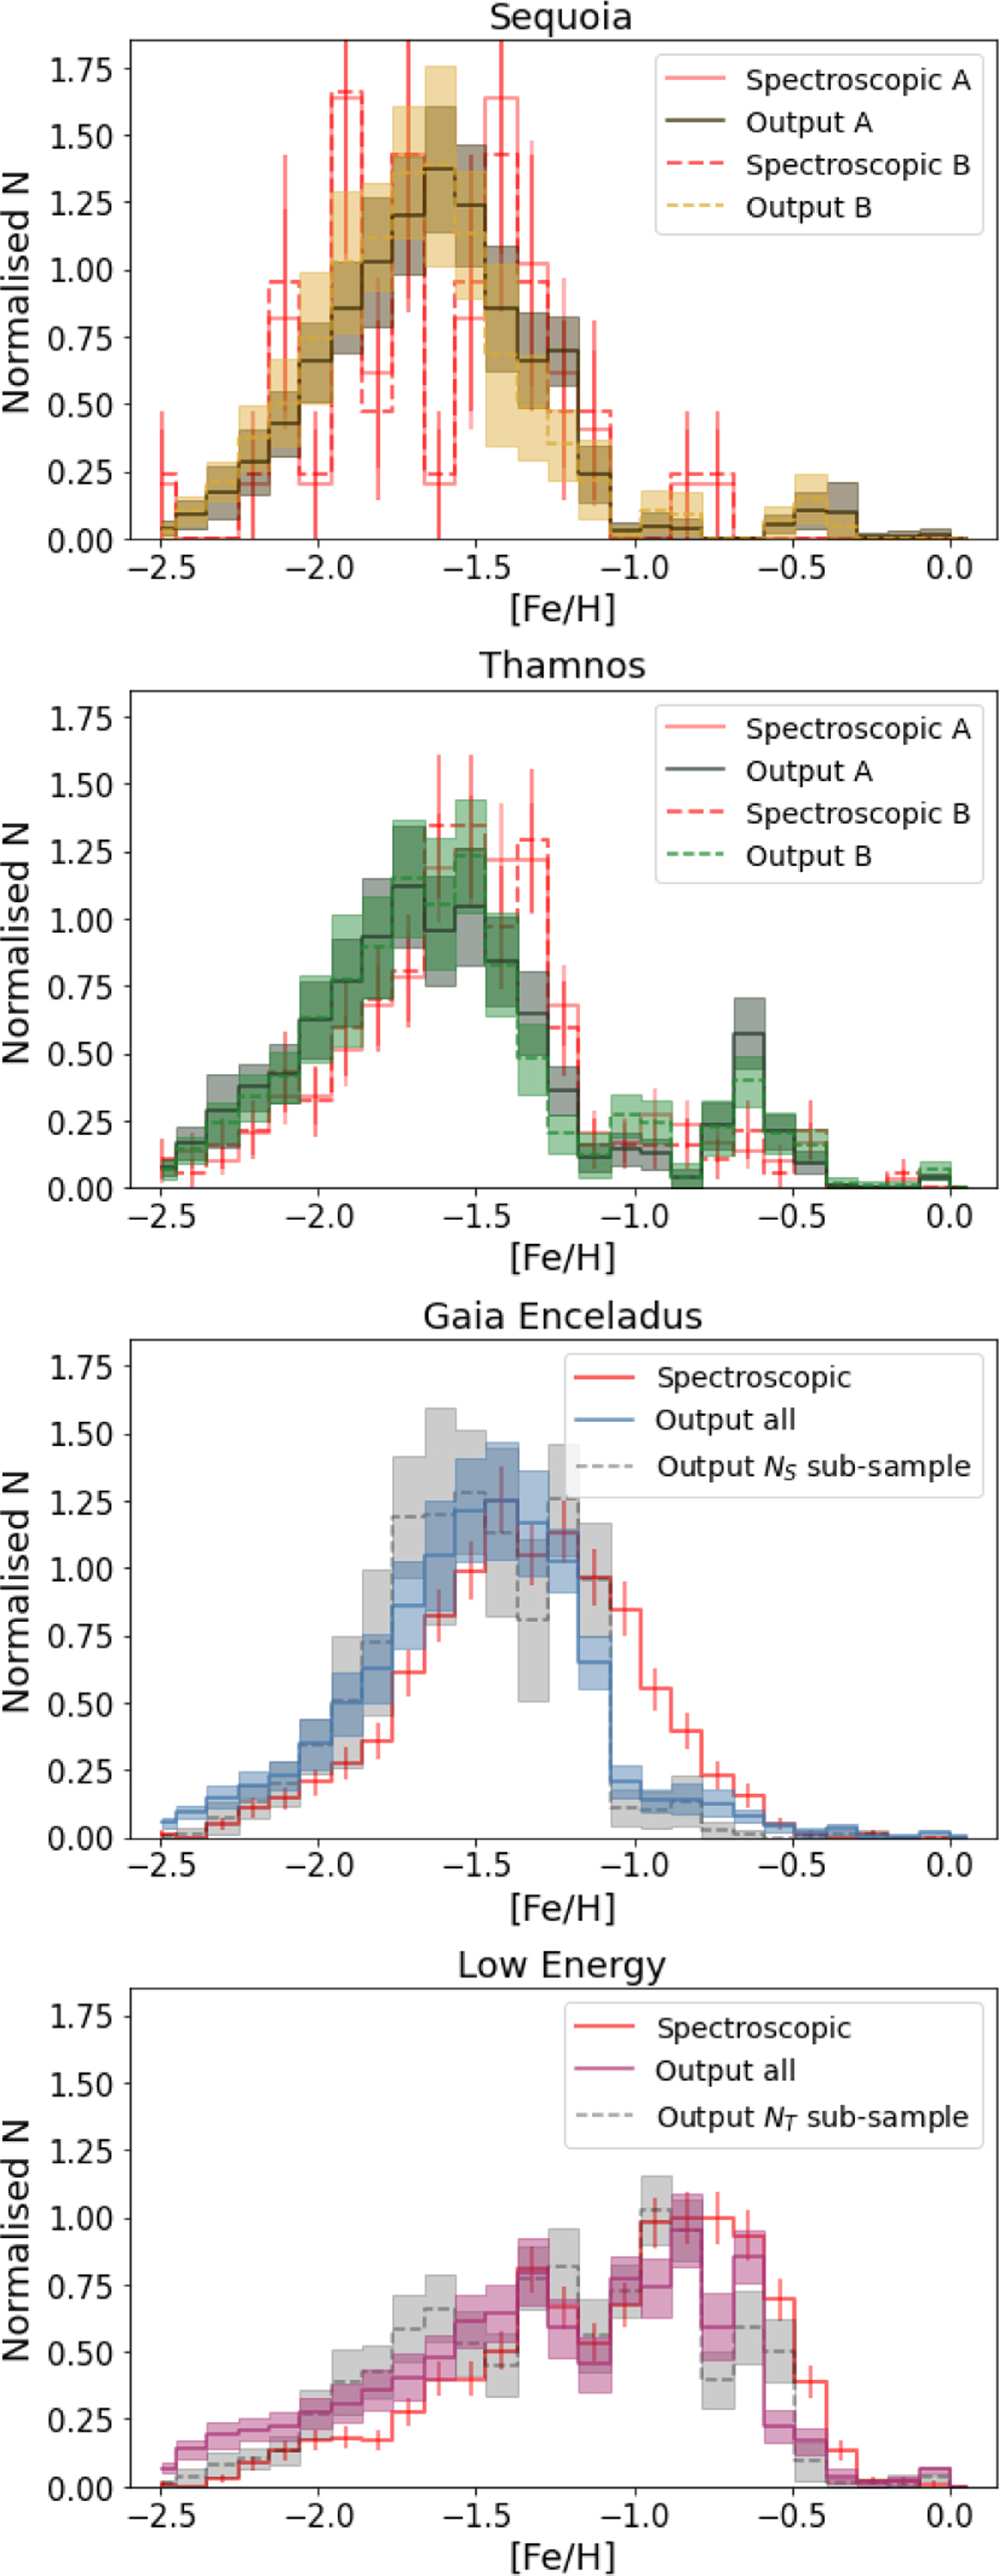
Metallicity distributions of the solution CMD stars for the different selections, binned according to the metallicity seeds used for fitting. The solid line shows the weighted mean count per metallicity bin and the shading indicates 1σ across 100 iterations. For GE (LE) the output of fitting all stars in the parent sample is shown and one random NS (NT) sub-sample. The spectroscopic metallicity distributions (using LAMOST LRS DR7), of the 5D selected samples used for CMD fitting, are also shown here in red. Here, the error bar indicates the Poisson noise (![]() ) in each bin.
) in each bin.
Current usage metrics show cumulative count of Article Views (full-text article views including HTML views, PDF and ePub downloads, according to the available data) and Abstracts Views on Vision4Press platform.
Data correspond to usage on the plateform after 2015. The current usage metrics is available 48-96 hours after online publication and is updated daily on week days.
Initial download of the metrics may take a while.