Fig. 11
Download original image
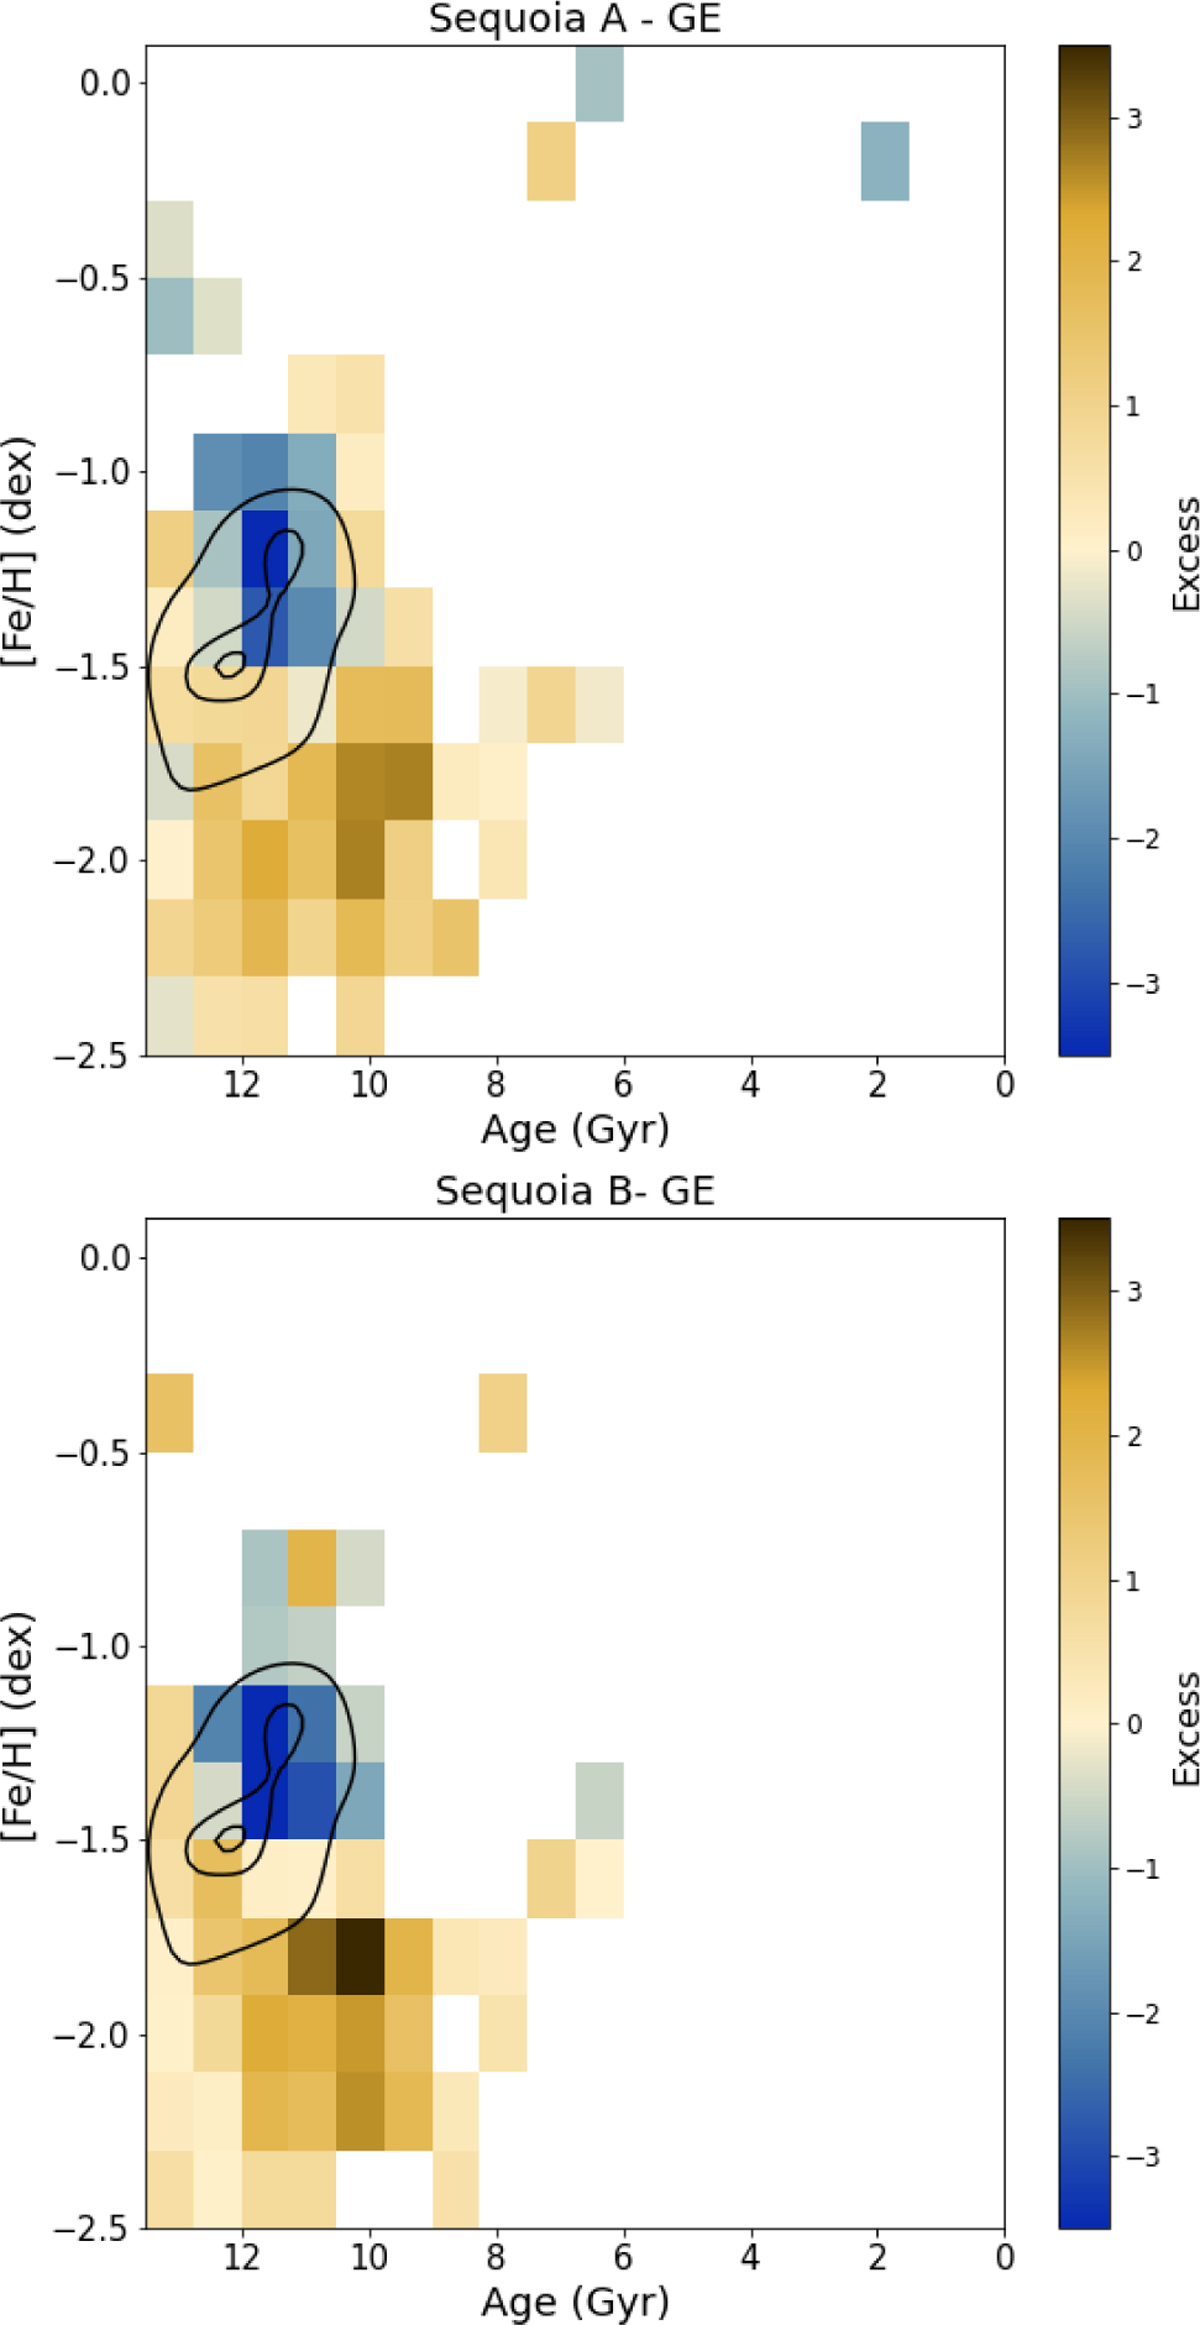
Residual age-metallicity space of the GE CMD stars subtracted from those of Sequoia A and B samples (B being the more conservative selection). The colour bar is the difference in the number of stars per bin divided by the combined errors on the count. The contours of the contamination (GE) age-metallicity distribution are shown for visual comparison.
Current usage metrics show cumulative count of Article Views (full-text article views including HTML views, PDF and ePub downloads, according to the available data) and Abstracts Views on Vision4Press platform.
Data correspond to usage on the plateform after 2015. The current usage metrics is available 48-96 hours after online publication and is updated daily on week days.
Initial download of the metrics may take a while.