Open Access
Fig. 10
Download original image
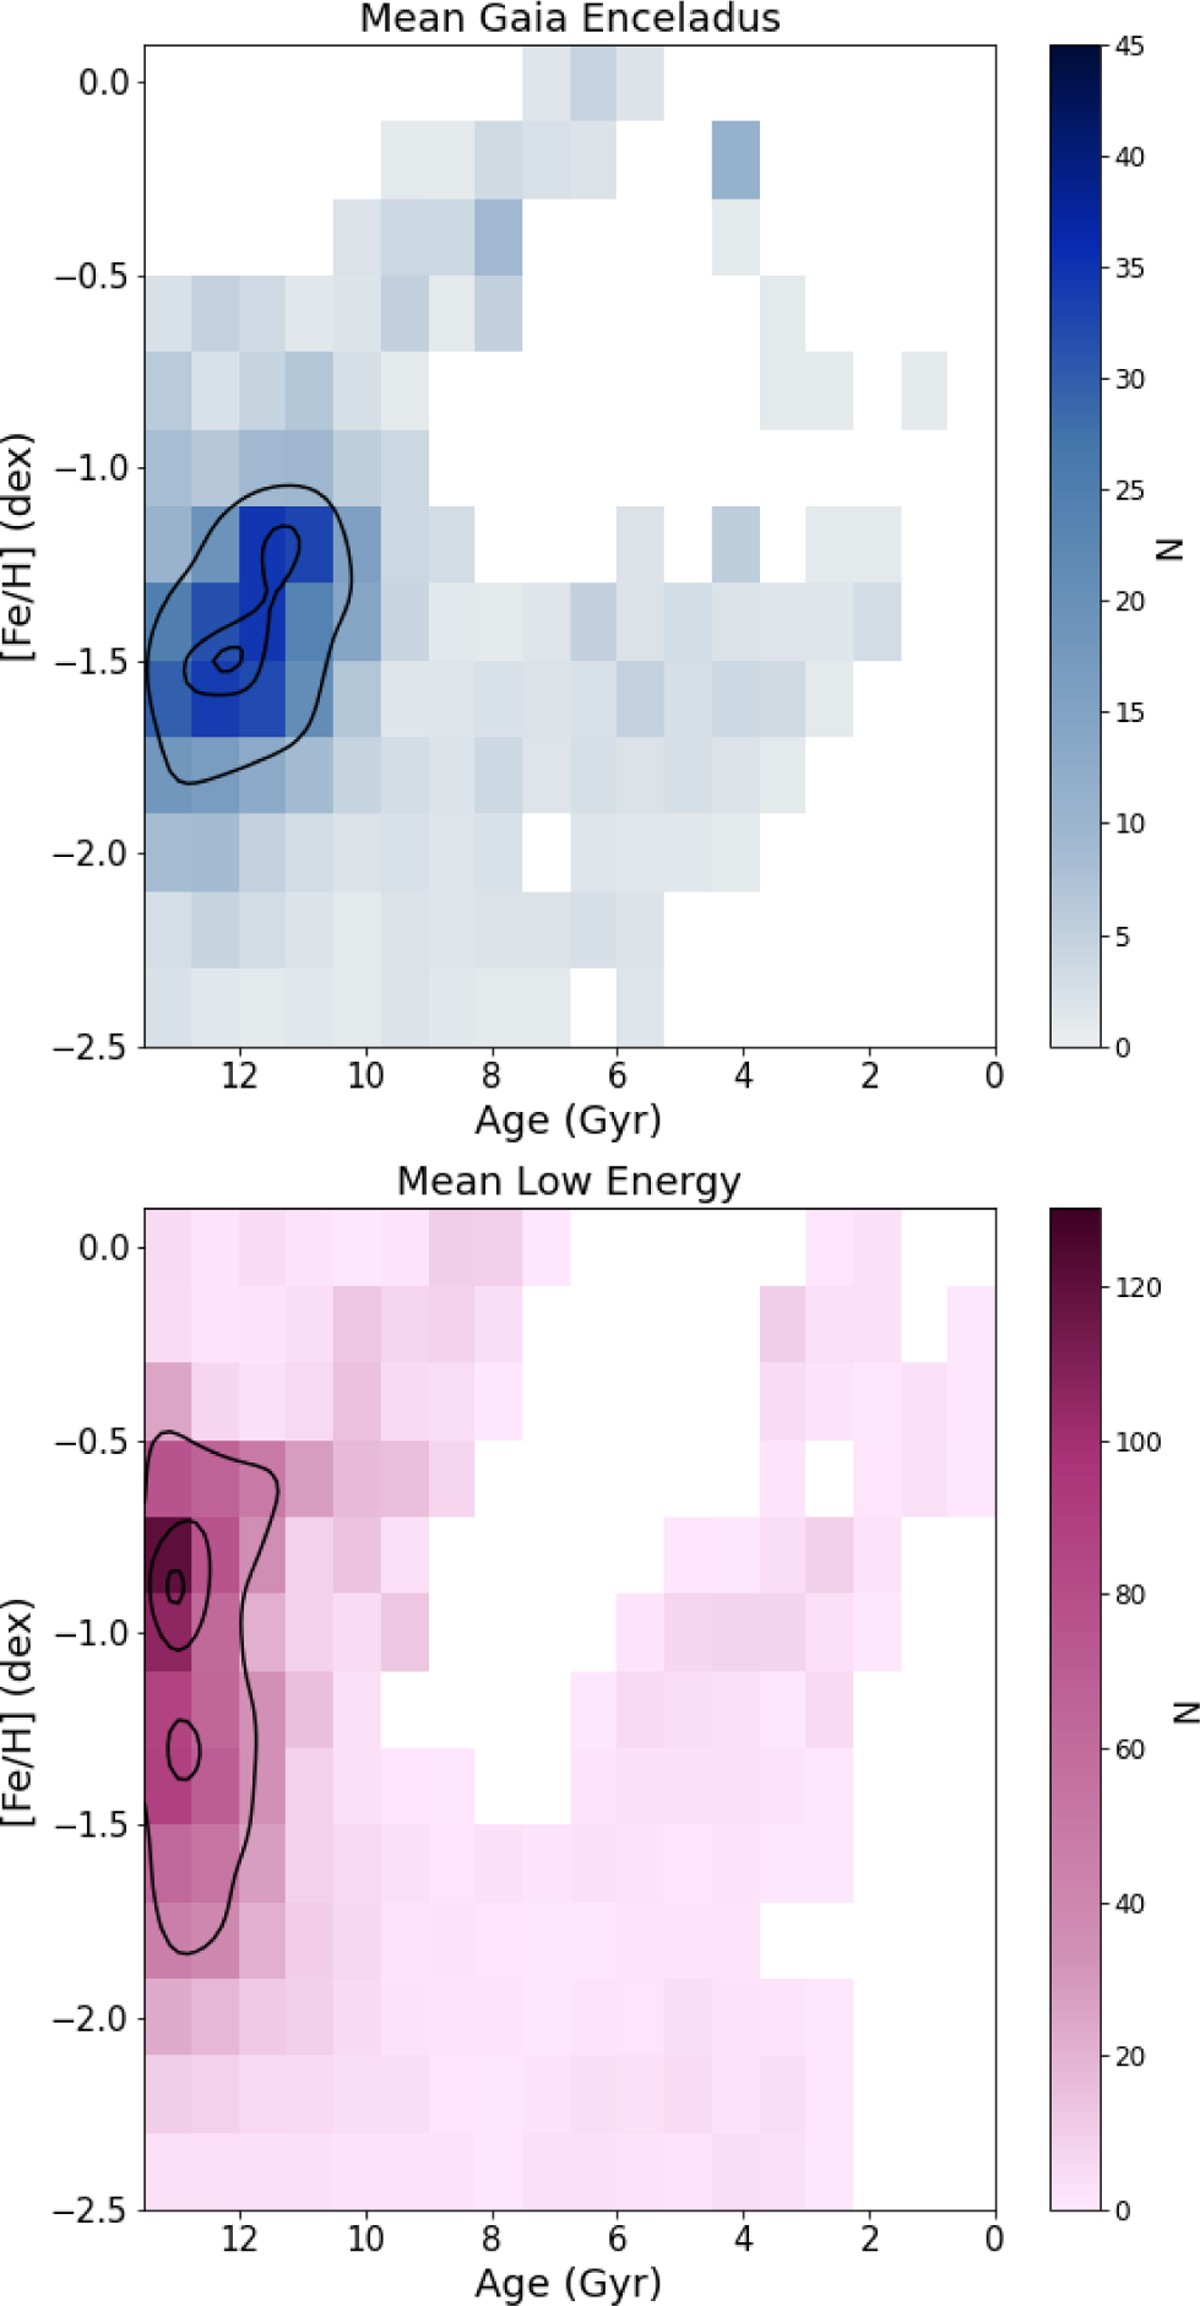
Age-metallicity space showing the mean of the best fit CMDs for 20 GE (left) and 20 LE (right) sub-samples. The colour bar shows the count. Contours are shown containing 39%, 87% and 99% of the counts (corresponding to 1, 2, and 3 σ in 2D, respectively).
Current usage metrics show cumulative count of Article Views (full-text article views including HTML views, PDF and ePub downloads, according to the available data) and Abstracts Views on Vision4Press platform.
Data correspond to usage on the plateform after 2015. The current usage metrics is available 48-96 hours after online publication and is updated daily on week days.
Initial download of the metrics may take a while.