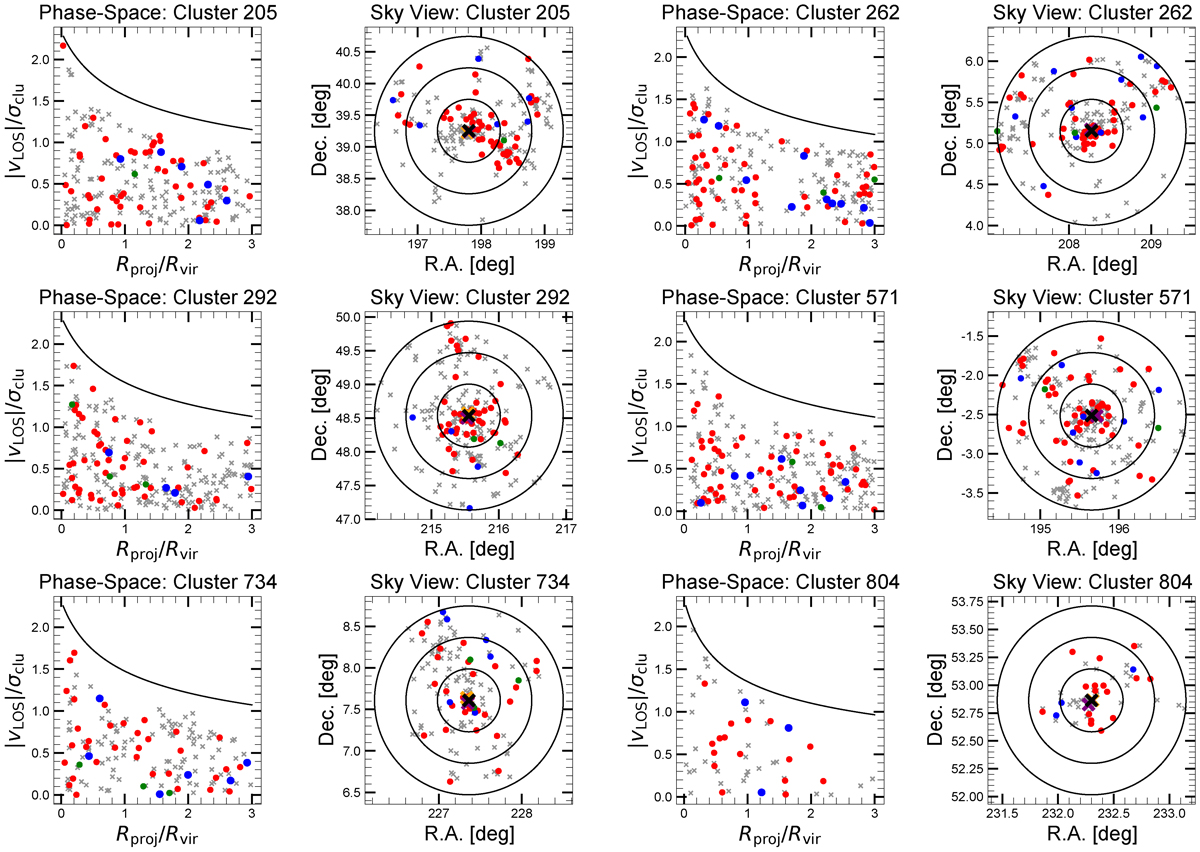
Fig. A.1.
Download original image
Projected phase space (left panels) and sky maps of the galaxy distribution (right panels) of the 14 most relaxed cluster regions analyzed in this work (MR sample). The caustic lines in the PPS diagrams have been calculated assuming that the total mass density of the clusters follows a NFW profile with a concentration parameter C = 6. The meaning of the different symbols and curves is explained in the accompanying text.
Current usage metrics show cumulative count of Article Views (full-text article views including HTML views, PDF and ePub downloads, according to the available data) and Abstracts Views on Vision4Press platform.
Data correspond to usage on the plateform after 2015. The current usage metrics is available 48-96 hours after online publication and is updated daily on week days.
Initial download of the metrics may take a while.