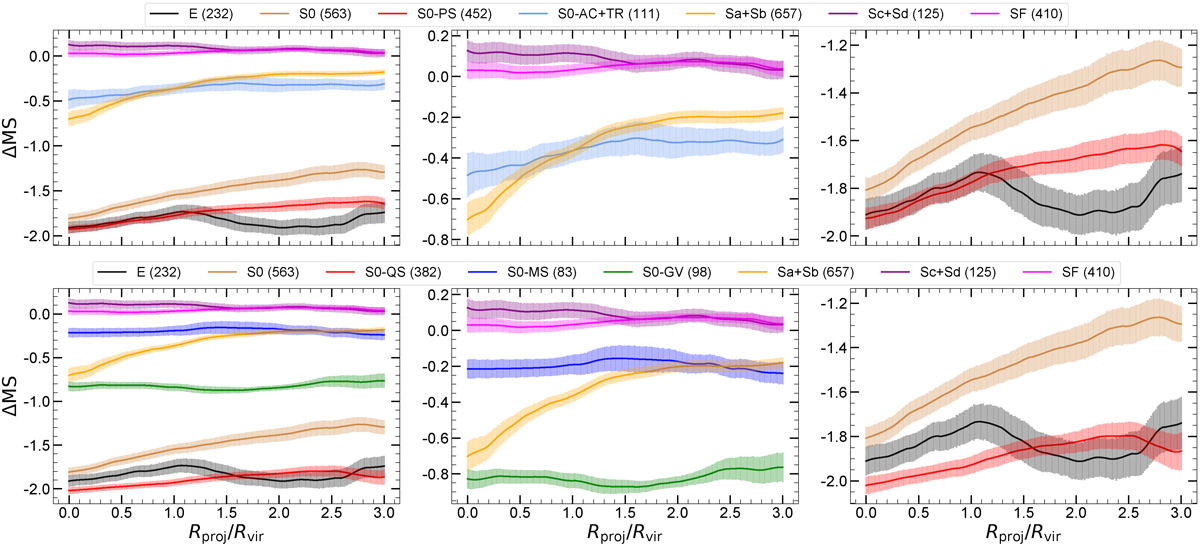
Fig. 7.
Download original image
Top row: Radial ΔMS profiles for PCA-classified lenticular galaxies: S0–AC+TR (light blue) and S0–PS (red), smoothed with a Gaussian kernel of bandwidth 0.4 Rvir. Bottom row: Same as the top row, but using the ΔMS-based classification: S0–MS (blue), S0–GV (green), and S0–QS (red). Each row also includes profiles for elliptical (E, black), early-type spiral (Sa+Sb, orange), late-type spiral (Sc+Sd, purple), star-forming (SF, magenta), and the full S0 population (brown). Columns show: left, all galaxy subsets; center, only those with evidence of star formation; right, the most quiescent ones. Clustercentric distances are normalized by the virial radius of each host cluster. Profiles are computed using data out to 4 Rvir, although the sample sizes shown in the legends correspond to galaxies within 3 Rvir (see text). Shaded regions represent 1σ confidence intervals from 1000 bootstrap resamples.
Current usage metrics show cumulative count of Article Views (full-text article views including HTML views, PDF and ePub downloads, according to the available data) and Abstracts Views on Vision4Press platform.
Data correspond to usage on the plateform after 2015. The current usage metrics is available 48-96 hours after online publication and is updated daily on week days.
Initial download of the metrics may take a while.