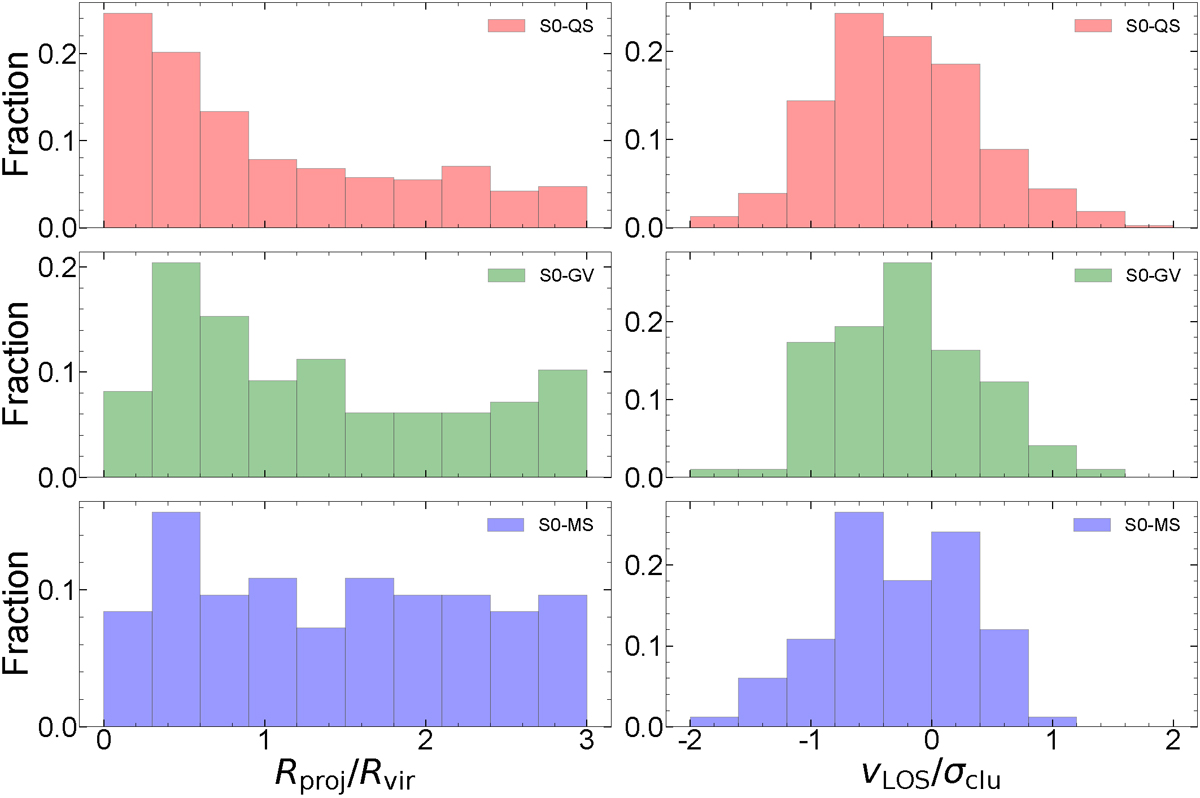
Fig. 4.
Download original image
Same as Fig. 2 but for the ΔMS classes of lenticular galaxies in the MR cluster sample. The top red histograms represent S0–QS galaxies, the middle green histograms correspond to S0–GV galaxies, and the bottom blue histograms depict S0–MS galaxies. A test of normality (D’Agostino 1971) yields p-values of 0.4413, 0.4708, 0.3168 for S0–QS, S0–GV, and S0–MS, respectively.
Current usage metrics show cumulative count of Article Views (full-text article views including HTML views, PDF and ePub downloads, according to the available data) and Abstracts Views on Vision4Press platform.
Data correspond to usage on the plateform after 2015. The current usage metrics is available 48-96 hours after online publication and is updated daily on week days.
Initial download of the metrics may take a while.