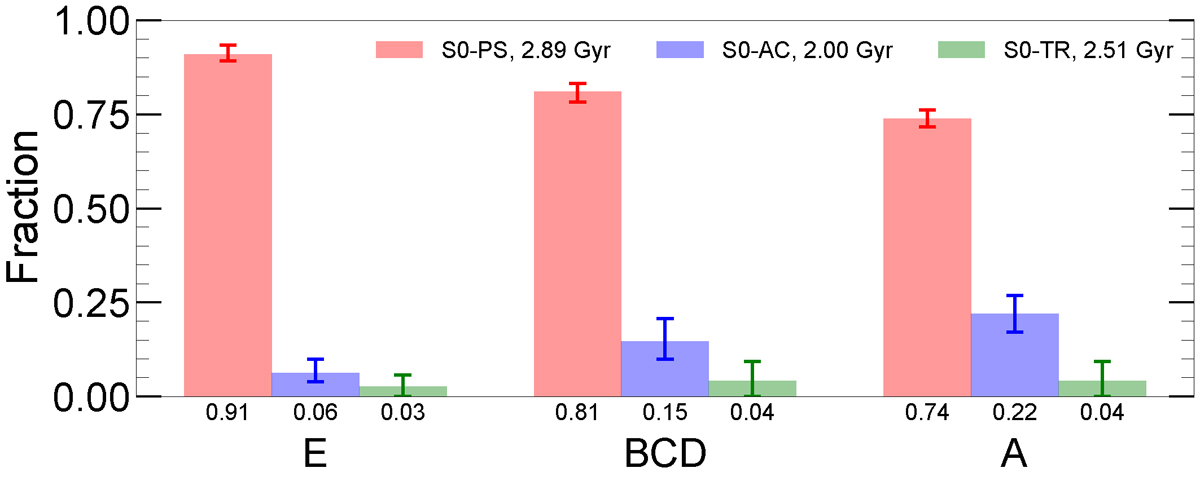
Fig. 3.
Download original image
Fractions of the various S0 spectral classes across the PPS infall regions defined in Fig. 1. Red bars represent S0–PS, blue bars S0–AC, and green bars S0–TR galaxies, with the numbers below the bars indicating their fractional abundances. The numbers following each label denote the average time since cluster infall for each S0 class, calculated by weighting their relative abundance in each infall region by the mean time since infall (see text). The 1σ error bars were derived from 1000 bootstrap resamples with replacement of the original distributions in each infall region.
Current usage metrics show cumulative count of Article Views (full-text article views including HTML views, PDF and ePub downloads, according to the available data) and Abstracts Views on Vision4Press platform.
Data correspond to usage on the plateform after 2015. The current usage metrics is available 48-96 hours after online publication and is updated daily on week days.
Initial download of the metrics may take a while.