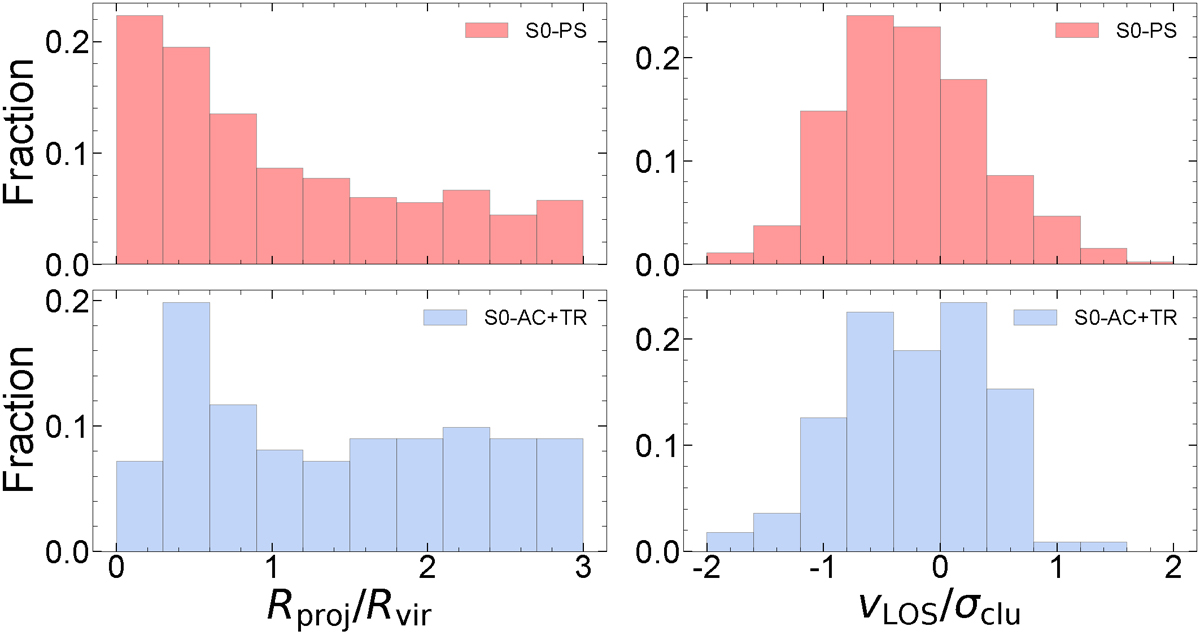
Fig. 2.
Download original image
Histograms of dimensionless projected clustercentric distance (left) and LOS peculiar velocity (right) for the passive (PS, top, red) and non-passive (AC+TR combined, bottom, light-blue) spectral classes of S0 galaxies in the MR cluster sample. A test of normality (D’Agostino 1971) yields p-values of 0.3243 and 0.3785 for S0–PS and S0–AC+TR, respectively.
Current usage metrics show cumulative count of Article Views (full-text article views including HTML views, PDF and ePub downloads, according to the available data) and Abstracts Views on Vision4Press platform.
Data correspond to usage on the plateform after 2015. The current usage metrics is available 48-96 hours after online publication and is updated daily on week days.
Initial download of the metrics may take a while.