Open Access
Fig. B.1.
Download original image
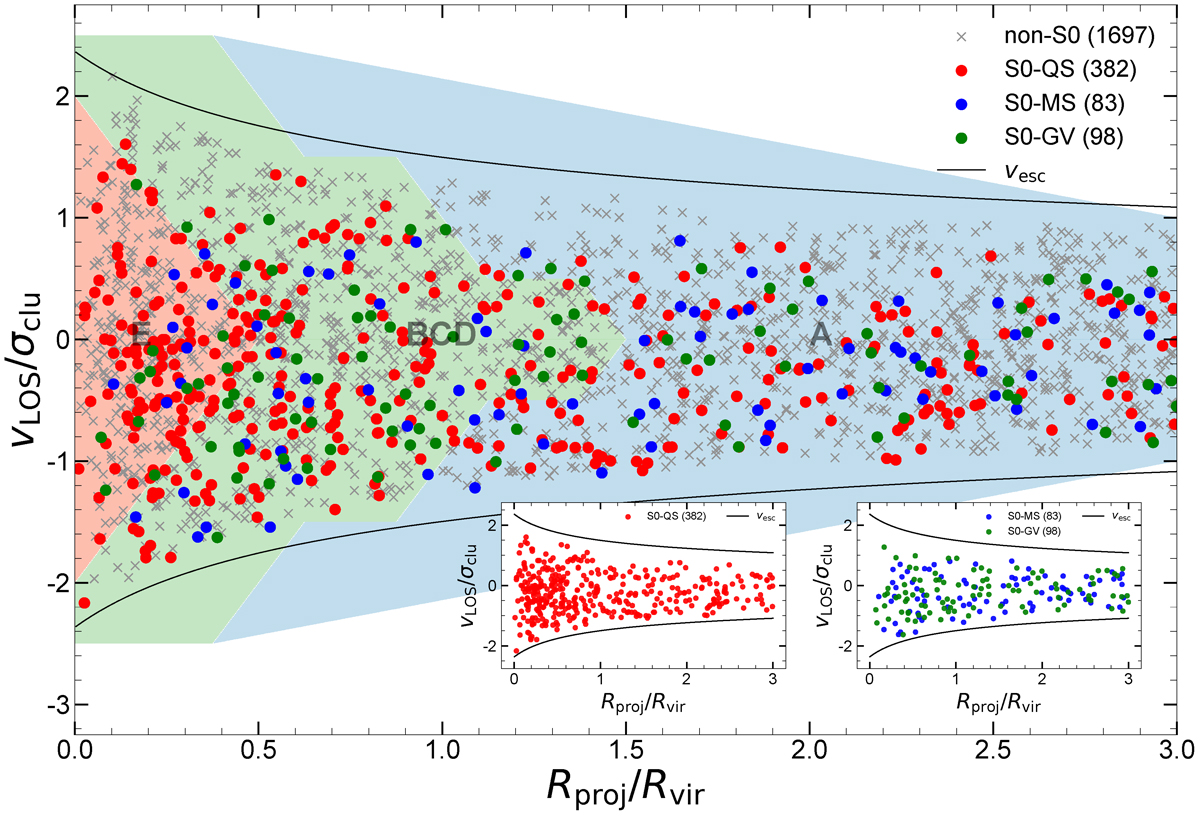
Same as Fig. 1, but with S0 galaxies divided by their distance from the main sequence: S0–QS (red), S0–MS (blue), and S0–GV (green). The inset panels display the PPS distributions separately for the QS (left) and the combined MS+GV classes (right) from the ΔMS classification scheme.
Current usage metrics show cumulative count of Article Views (full-text article views including HTML views, PDF and ePub downloads, according to the available data) and Abstracts Views on Vision4Press platform.
Data correspond to usage on the plateform after 2015. The current usage metrics is available 48-96 hours after online publication and is updated daily on week days.
Initial download of the metrics may take a while.