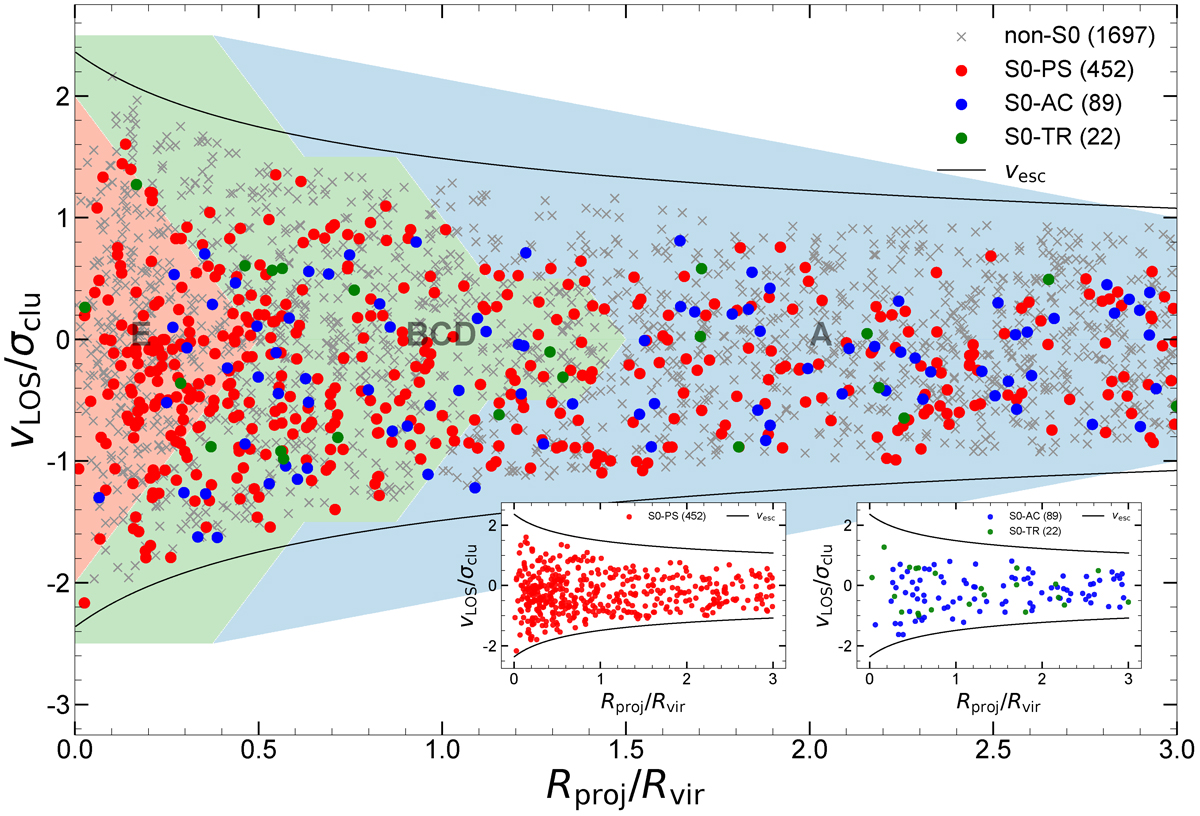
Fig. 1.
Download original image
Projected phase-space diagram of all galaxies in the 14 clusters that constitute the most relaxed (MR) cluster sample. Non-S0 galaxies are shown as gray crosses, while S0 galaxies are represented by filled circles: Red for S0–PS, blue for S0–AC, and green for S0–TR. The projected radii and LOS velocities of all galaxies are normalized by the virial radius and velocity dispersion of their host clusters. The data are enclosed by the common caustics (black curves), which provide an estimate of the ensemble’s escape velocity, while the colored shaded regions indicate the basic infall zones defined by Rhee et al. (2017) (see text for details). Two inset panels are included to emphasize the contrasting distributions of PS (left) and AC+TR lenticulars (right).
Current usage metrics show cumulative count of Article Views (full-text article views including HTML views, PDF and ePub downloads, according to the available data) and Abstracts Views on Vision4Press platform.
Data correspond to usage on the plateform after 2015. The current usage metrics is available 48-96 hours after online publication and is updated daily on week days.
Initial download of the metrics may take a while.