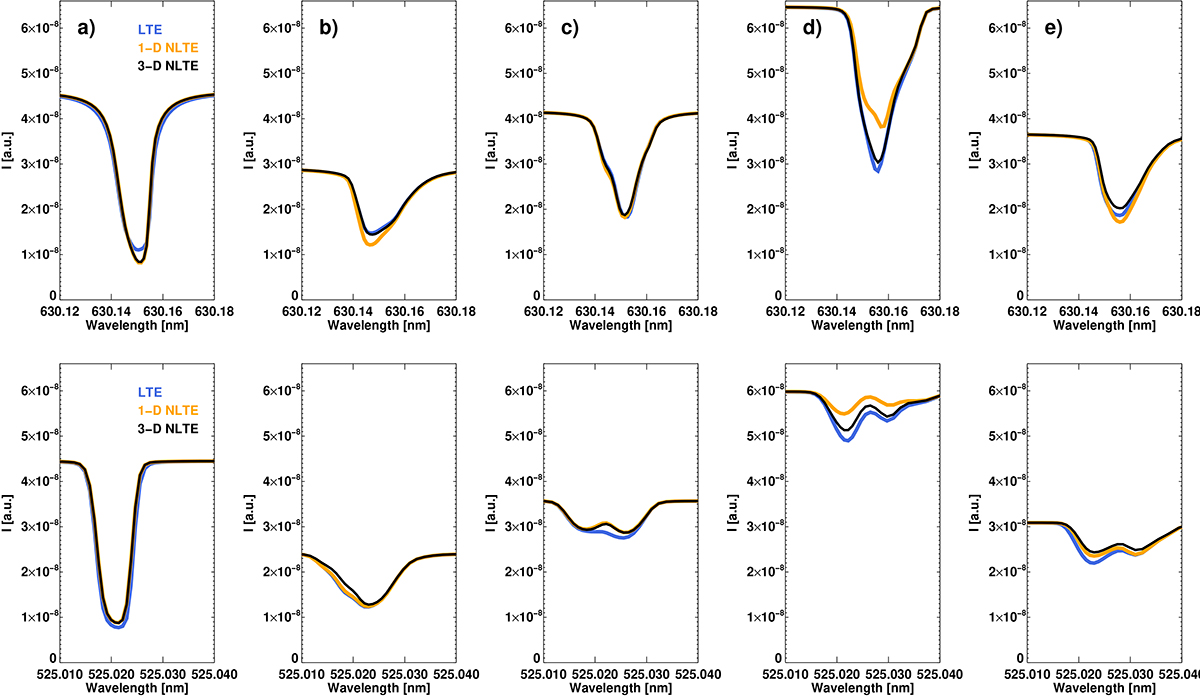
Fig. 7.
Download original image
Intensity profiles of the 630.15 nm (upper row) and the 525.02 nm (lower row) lines at five selected spatial positions indicated in Figure 5. Ordering: (a) location with lowest y co-ordinate (granule) to (e) location with largest y co-ordinate (at the upper boundary of the FS). Legends explaining the colours of the curves are given in panel a.
Current usage metrics show cumulative count of Article Views (full-text article views including HTML views, PDF and ePub downloads, according to the available data) and Abstracts Views on Vision4Press platform.
Data correspond to usage on the plateform after 2015. The current usage metrics is available 48-96 hours after online publication and is updated daily on week days.
Initial download of the metrics may take a while.