Fig. 2.
Download original image
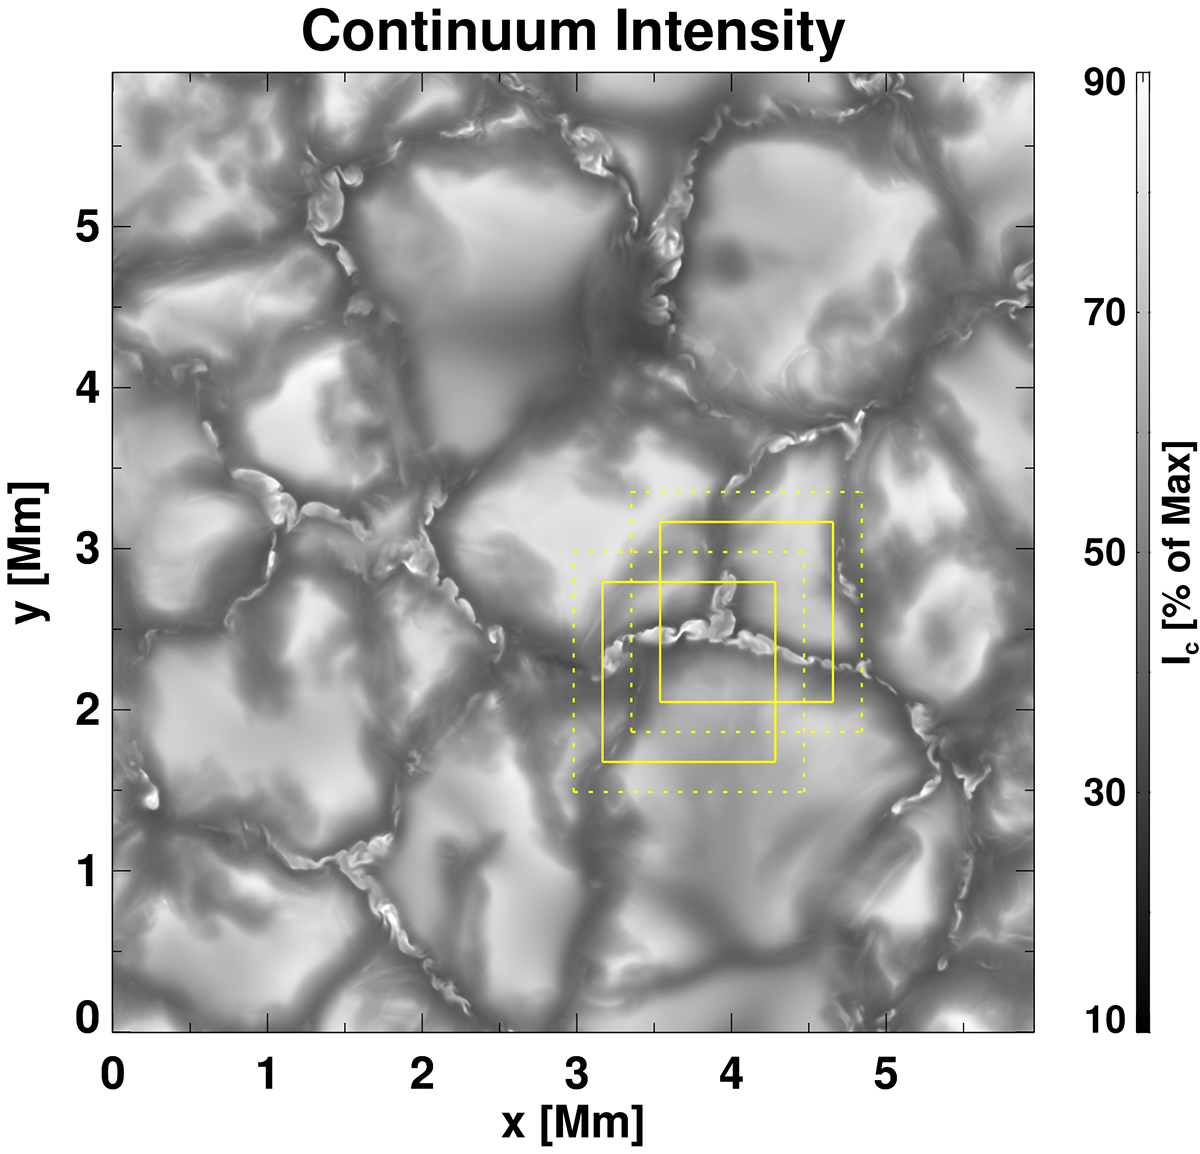
Continuum intensity at a wavelength close to the 525 nm lines. The squares indicate the two selected sub-domains that were calculated in full 3D NLTE. The bigger dashed squares indicate the domain used for calculations, while the smaller solid squares within the dashed squares represent the areas that were used for our investigation.
Current usage metrics show cumulative count of Article Views (full-text article views including HTML views, PDF and ePub downloads, according to the available data) and Abstracts Views on Vision4Press platform.
Data correspond to usage on the plateform after 2015. The current usage metrics is available 48-96 hours after online publication and is updated daily on week days.
Initial download of the metrics may take a while.