Fig. 11.
Download original image
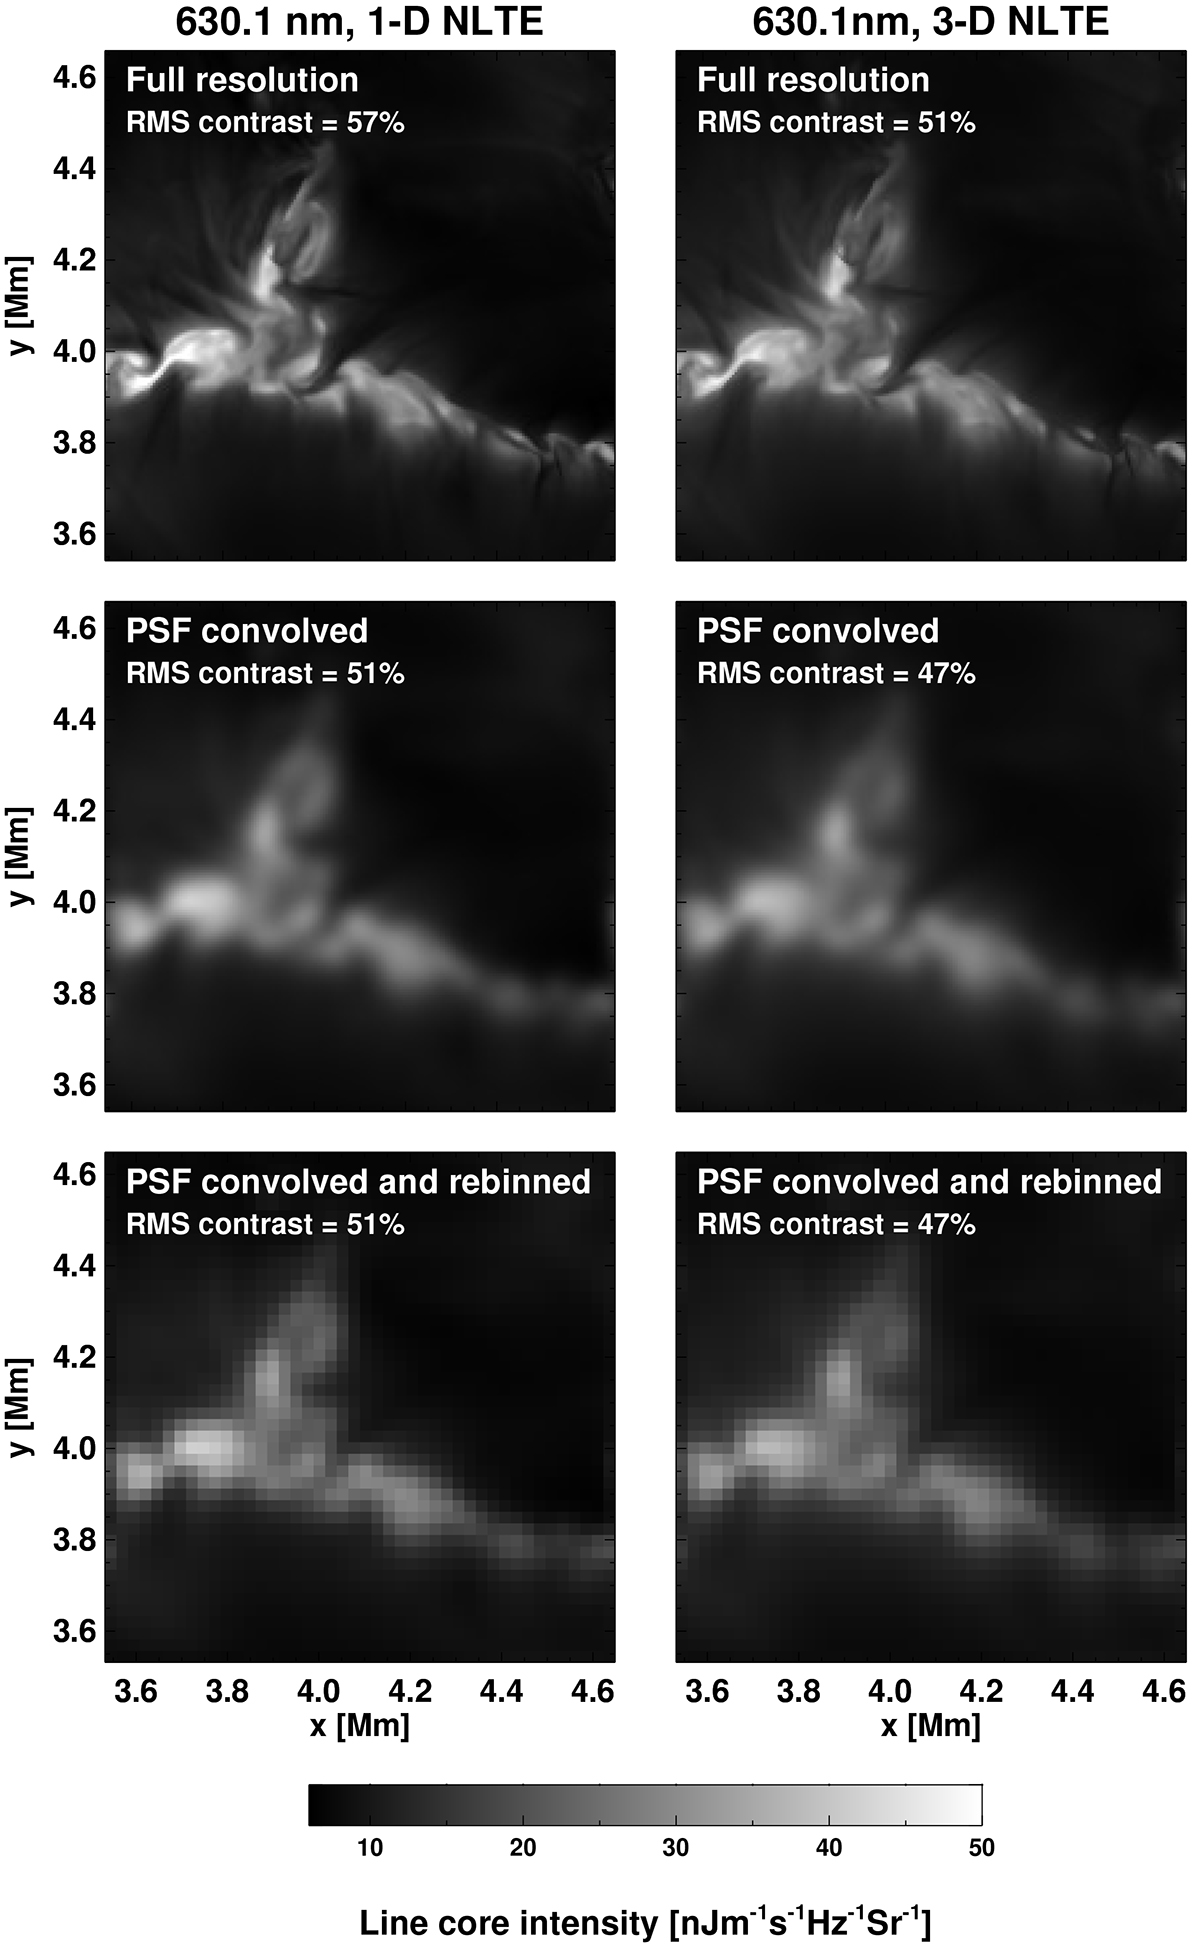
Comparison of intensity maps at the rest wavelength of the 630.1 nm line from 1D NLTE and 3D NLTE computations. The top row shows images at the full resolution of the MHD cube, while for the images in the lower rows a spatial degradation has been applied, first by convolving with a PSF (middle row) and then by re-binning to the detector pixel resolution (bottom row).
Current usage metrics show cumulative count of Article Views (full-text article views including HTML views, PDF and ePub downloads, according to the available data) and Abstracts Views on Vision4Press platform.
Data correspond to usage on the plateform after 2015. The current usage metrics is available 48-96 hours after online publication and is updated daily on week days.
Initial download of the metrics may take a while.