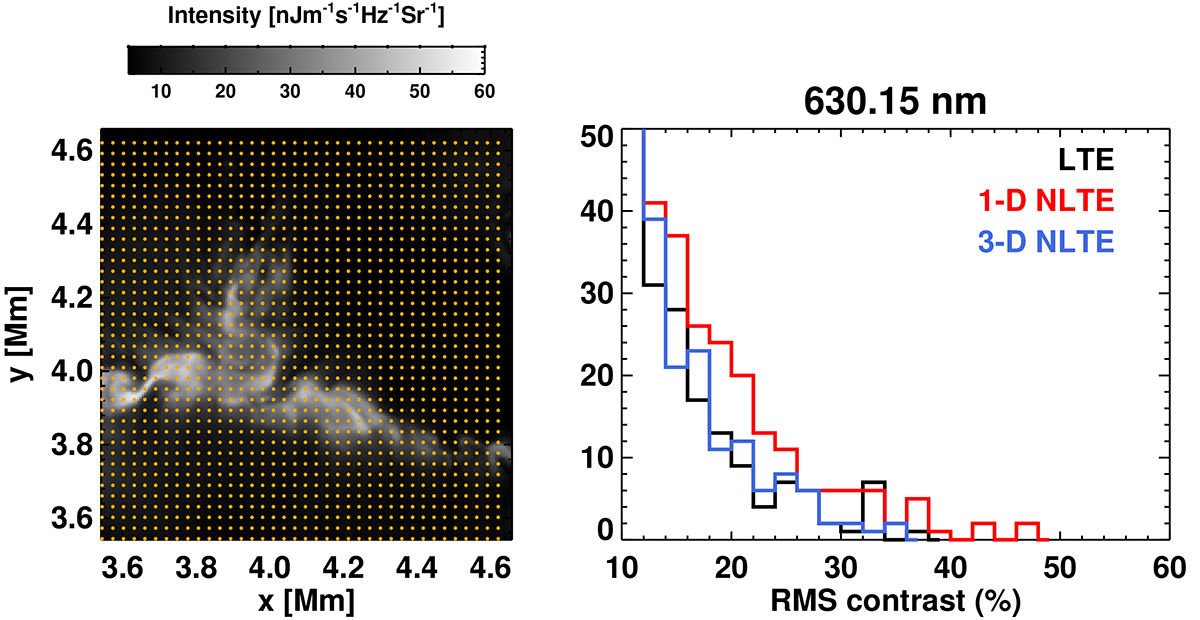
Fig. 10.
Download original image
Histogram of RMS contrast of small areas: we divided the full area of the intensity image into a grid of squares, each of which had a size of 5 pixels × 5 pixels. The grid is indicated as orange dots on the intensity image shown in the left panel. A histogram of the RMS contrasts computed at every square in the grid is shown in the right panel, for the three computation methods: LTE (black), 1D NLTE (red), and 3D NLTE (blue). The x axis has been clipped to show only bins with contrasts ≥10%.
Current usage metrics show cumulative count of Article Views (full-text article views including HTML views, PDF and ePub downloads, according to the available data) and Abstracts Views on Vision4Press platform.
Data correspond to usage on the plateform after 2015. The current usage metrics is available 48-96 hours after online publication and is updated daily on week days.
Initial download of the metrics may take a while.