Open Access
Fig. 2
Download original image
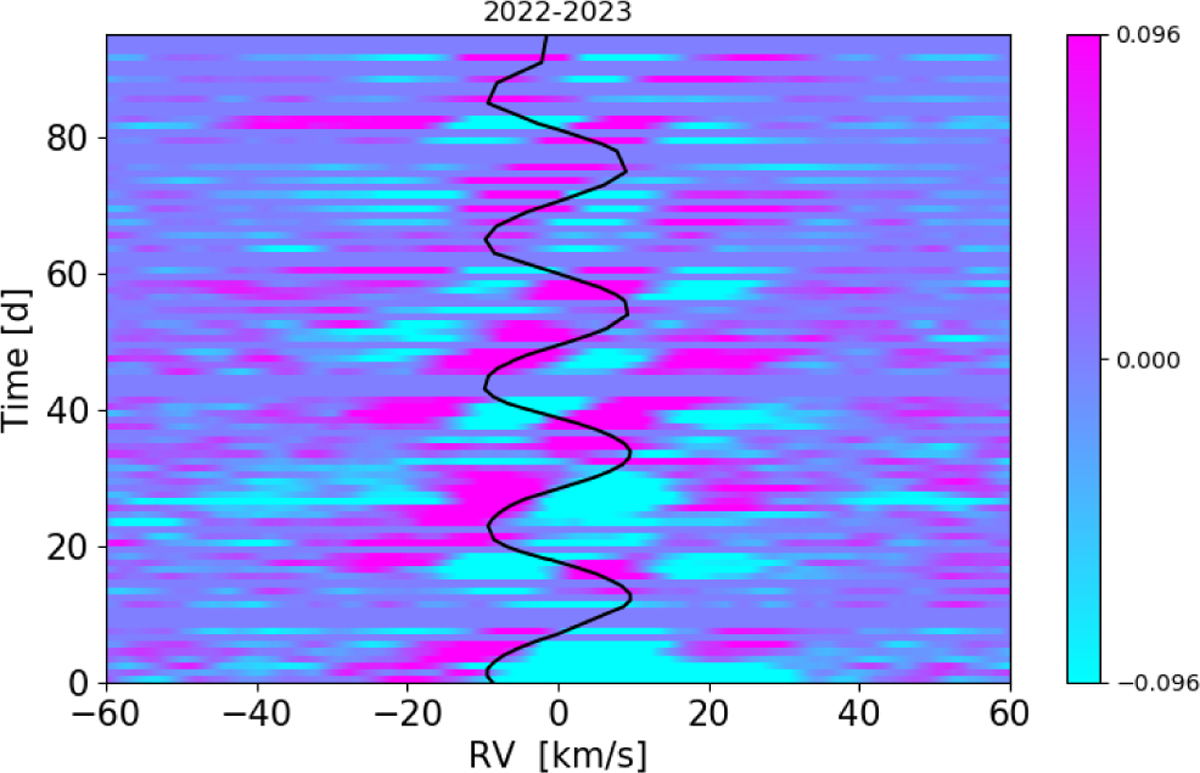
Line profile evolution of an average line profile of nine Fe I lines. The colour scale gives the difference of the normalised flux density to the (also normalised) mean spectrum. The black line marks our RV determination from Sect. 4.2 with its mean shifted to zero RV for display convenience.
Current usage metrics show cumulative count of Article Views (full-text article views including HTML views, PDF and ePub downloads, according to the available data) and Abstracts Views on Vision4Press platform.
Data correspond to usage on the plateform after 2015. The current usage metrics is available 48-96 hours after online publication and is updated daily on week days.
Initial download of the metrics may take a while.