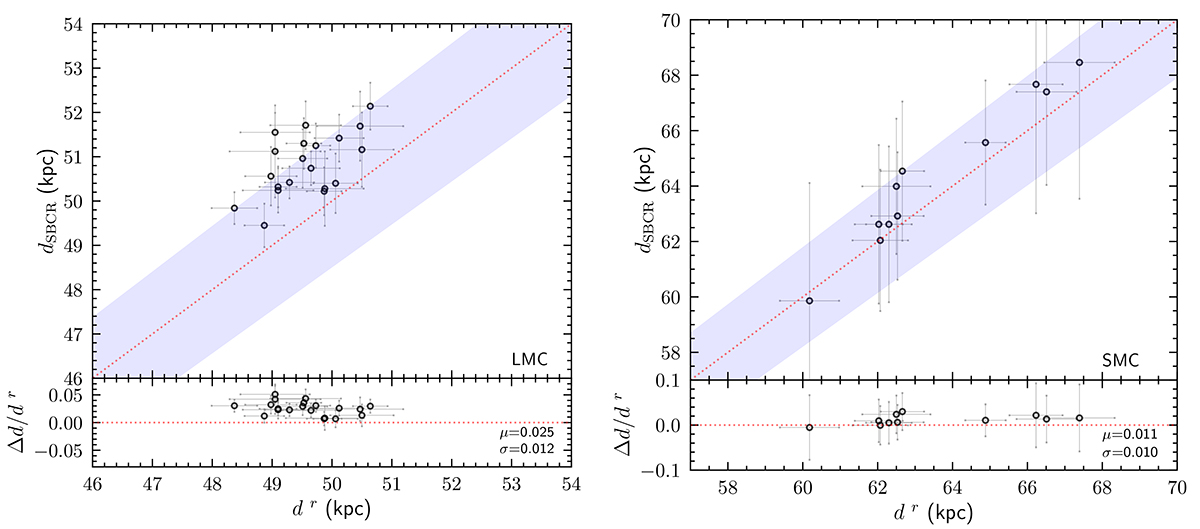
Fig. 7.
Download original image
Comparison of distance (d) estimates for eclipsing binaries in the LMC (left panel) and the SMC (right panel). The x axis represents distances (dr) of eclipsing binaries derived from the literature (dr). The y axis shows distances (dSBCR) estimated using the SBCR developed in this study (SV = (1.230 ± 0.021)(V − Ks)0 + (2.845 ± 0.048)). The shaded blue area indicates a deviation range of ±3%. The bottom panel illustrates the distribution of relative errors (Δd/dr = (dSBCR − dr)/dr).
Current usage metrics show cumulative count of Article Views (full-text article views including HTML views, PDF and ePub downloads, according to the available data) and Abstracts Views on Vision4Press platform.
Data correspond to usage on the plateform after 2015. The current usage metrics is available 48-96 hours after online publication and is updated daily on week days.
Initial download of the metrics may take a while.