Fig. 6.
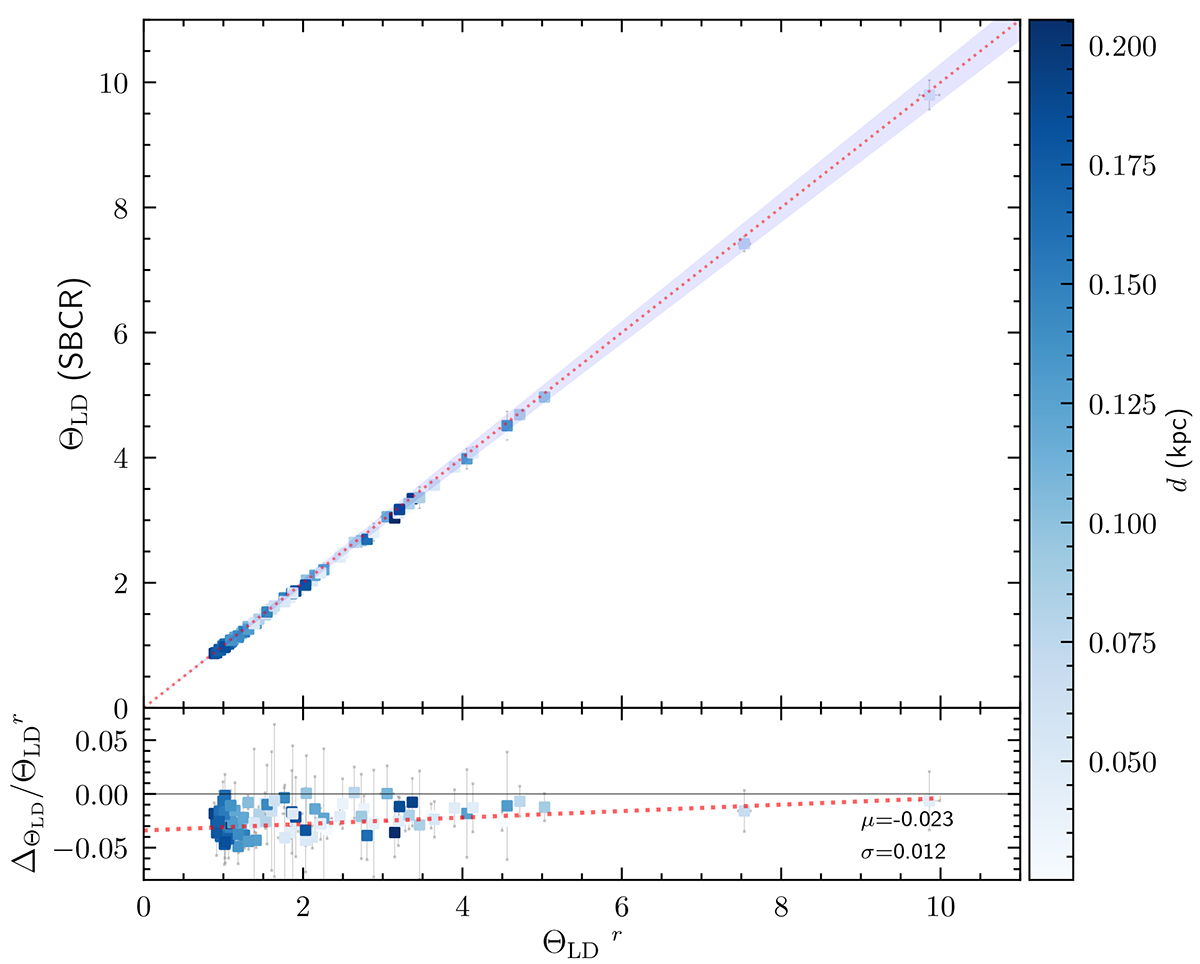
Download original image
Comparison of angular diameters (ΘLD). The x axis represents ΘLD directly measured using LBI (Pietrzyński et al. 2019; Salsi et al. 2020, 2021), while the y axis shows angular diameters estimated using the relation proposed in this study (SV = (1.230 ± 0.021)(V − Ks)0 + (2.845 ± 0.048)). The shaded blue area indicates a deviation range of ±3%. The bottom panel displays the relative differences between the SBCR-derived angular diameters and the interferometric angular diameters. The colors of the squares represent the distances of target (derived from parallaxes of HIPPARCOS; van Leeuwen 2007). Darker colors correspond to the larger distances.
Current usage metrics show cumulative count of Article Views (full-text article views including HTML views, PDF and ePub downloads, according to the available data) and Abstracts Views on Vision4Press platform.
Data correspond to usage on the plateform after 2015. The current usage metrics is available 48-96 hours after online publication and is updated daily on week days.
Initial download of the metrics may take a while.