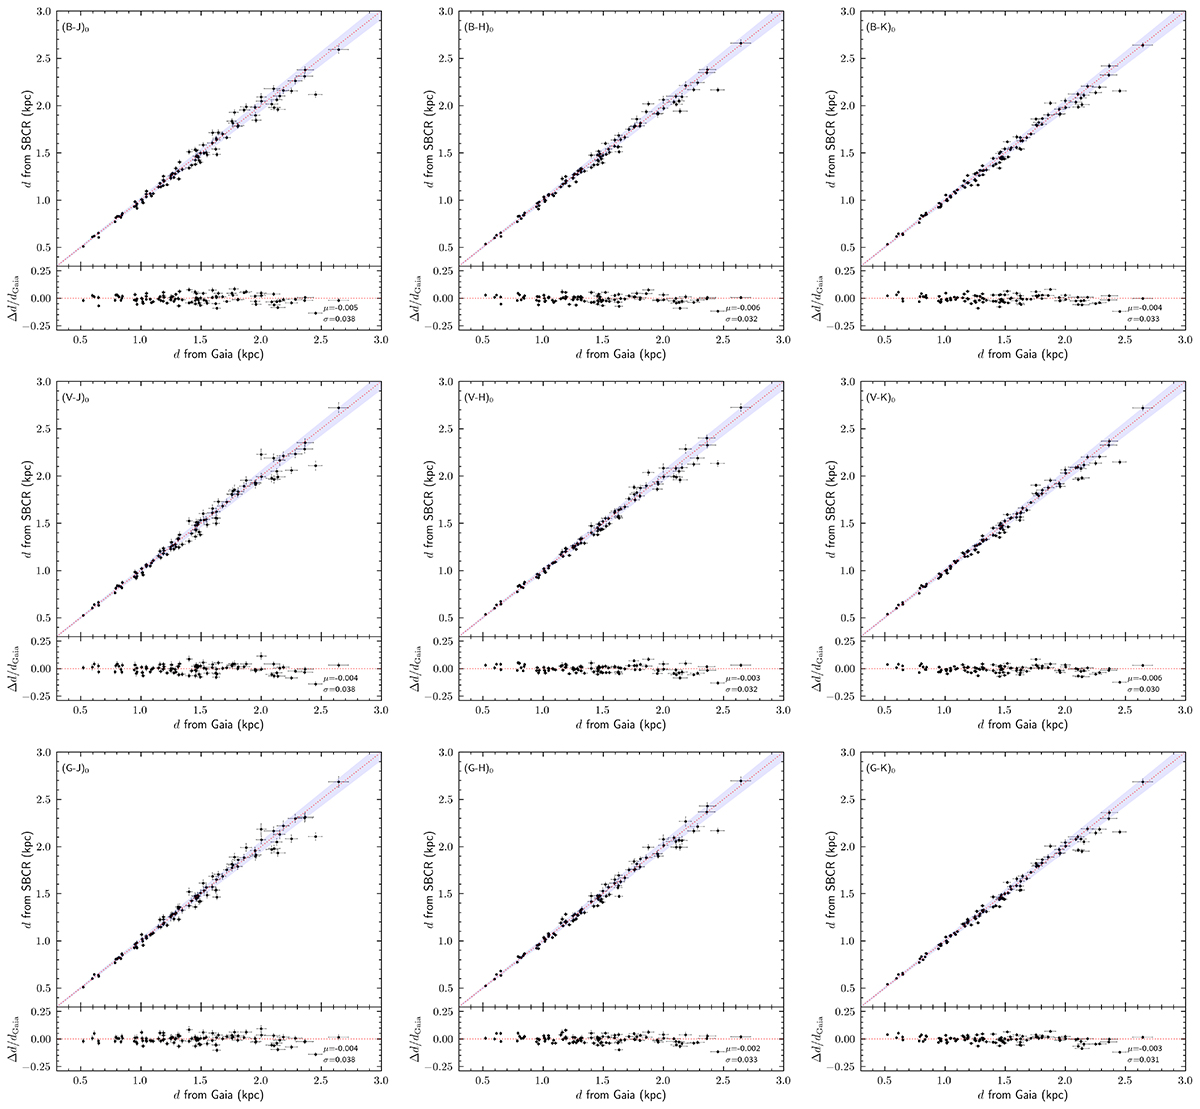
Fig. 5.
Download original image
Validation results of the testing samples. Similar to Fig. 4, the x axis represents distances measured by Gaia (Bailer-Jones et al. 2021), while the y axis shows distances estimated using the SBCRs in the Johnson B and V bands and the Gaia G band. The shaded blue area indicates a deviation range of ±3%. The lower subplot displays the distribution of relative errors (Δd/dGaia, Δd was calculated by dSBCR − dGaia).
Current usage metrics show cumulative count of Article Views (full-text article views including HTML views, PDF and ePub downloads, according to the available data) and Abstracts Views on Vision4Press platform.
Data correspond to usage on the plateform after 2015. The current usage metrics is available 48-96 hours after online publication and is updated daily on week days.
Initial download of the metrics may take a while.