Open Access
Fig. 3.
Download original image
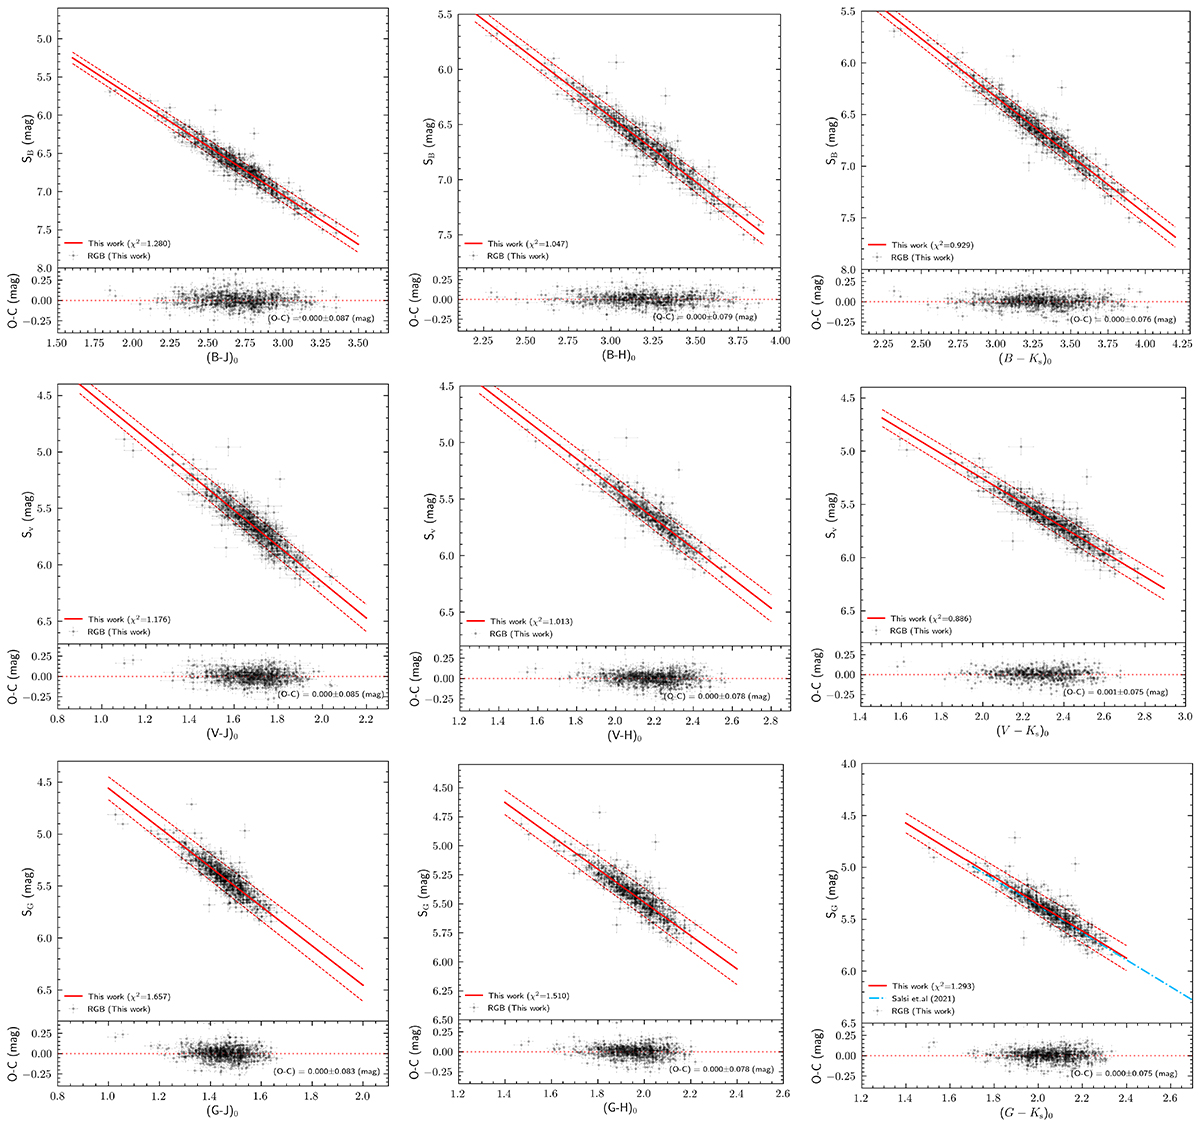
Fitting results of the surface brightness, Sλ, in the Johnson B and V bands and Gaia G band for RGB stars. Black points represent the 526 observed RGB stars. Solid red lines depict the fitting relations, while dashed red lines denote the associated uncertainties. The bottom panel displays the residuals of the fit.
Current usage metrics show cumulative count of Article Views (full-text article views including HTML views, PDF and ePub downloads, according to the available data) and Abstracts Views on Vision4Press platform.
Data correspond to usage on the plateform after 2015. The current usage metrics is available 48-96 hours after online publication and is updated daily on week days.
Initial download of the metrics may take a while.