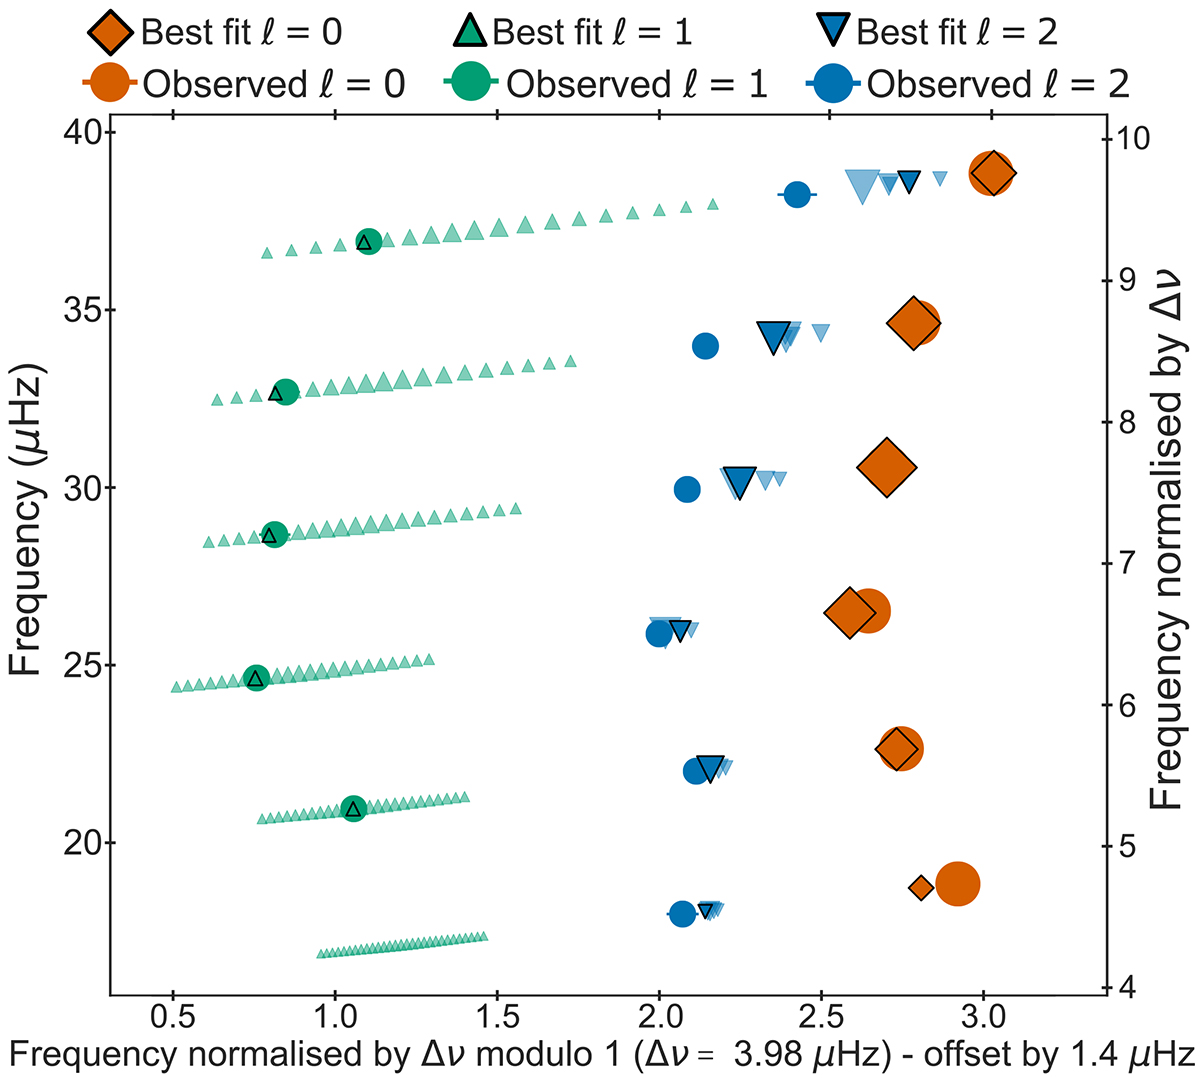
Fig. 8.
Download original image
Échelle diagram of Rogue with the fitted individual frequencies matched to the modes of the best-fitting model. The orange diamonds, green upwards, and blue downwards triangles depict the ℓ = 0, ℓ = 1, and ℓ = 2 modes, respectively. The cubic term of the surface correction by Ball & Gizon (2014) has been applied to the model modes, with a surface correction coefficient of a3 = −1.5554 ⋅ 10−7. The size of the model modes is scaled related to the inverse of their respective inertia. An offset has been applied to the x-axis for improved visualisation to avoid wrapping of the radial ridge.
Current usage metrics show cumulative count of Article Views (full-text article views including HTML views, PDF and ePub downloads, according to the available data) and Abstracts Views on Vision4Press platform.
Data correspond to usage on the plateform after 2015. The current usage metrics is available 48-96 hours after online publication and is updated daily on week days.
Initial download of the metrics may take a while.