Fig. 4.
Download original image
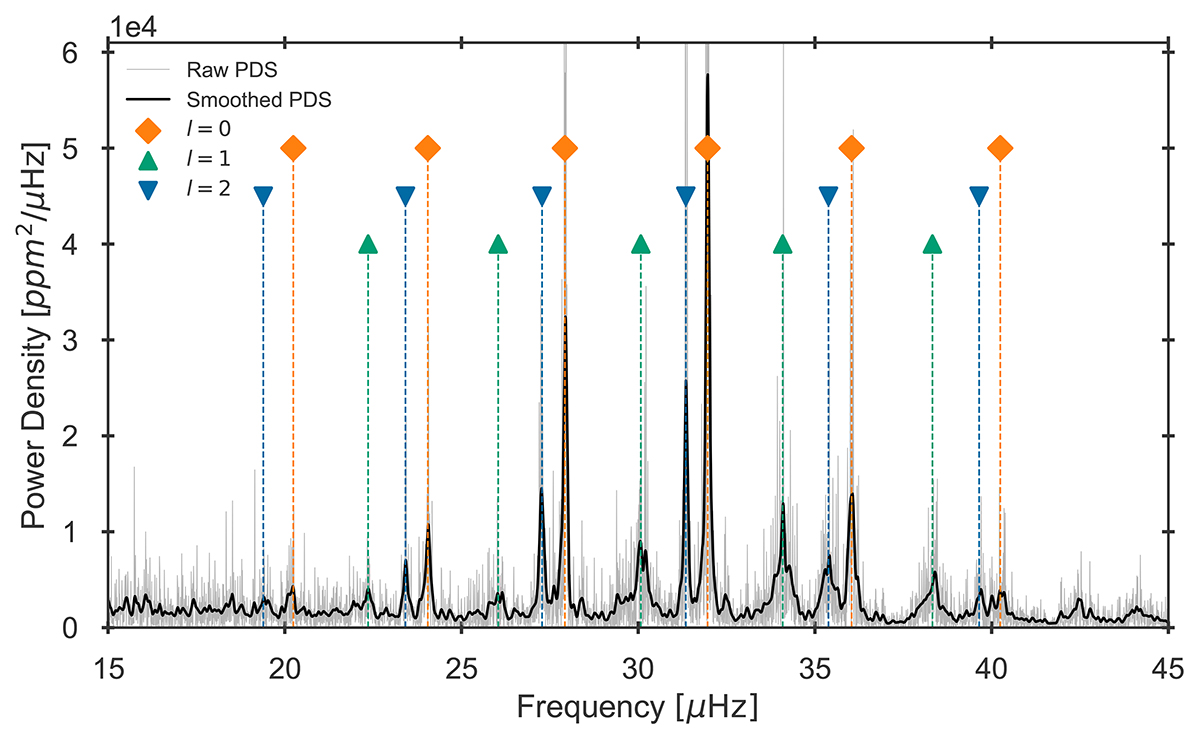
Power density spectrum of Rogue with the consolidated list of individual frequencies from Table A.3 overplotted. Both the raw spectrum and a Gaussian smoothed version are shown as the shaded gray and black spectra, respectively. The orange diamonds, green upwards, and blue downwards triangles depict the ℓ = 0, ℓ = 1, and ℓ = 2 modes, respectively.
Current usage metrics show cumulative count of Article Views (full-text article views including HTML views, PDF and ePub downloads, according to the available data) and Abstracts Views on Vision4Press platform.
Data correspond to usage on the plateform after 2015. The current usage metrics is available 48-96 hours after online publication and is updated daily on week days.
Initial download of the metrics may take a while.