Fig. 1.
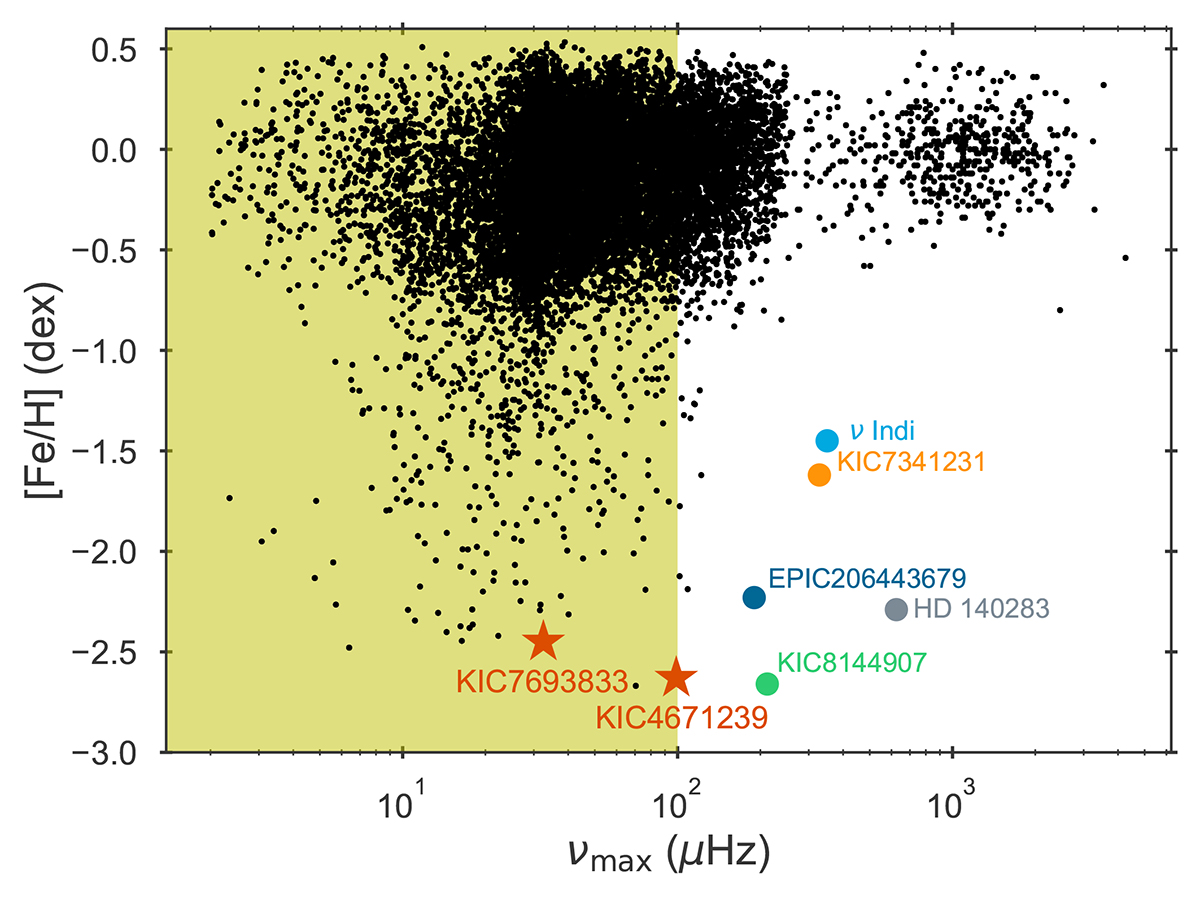
Download original image
Metallicity [Fe/H] plotted against the frequency of maximum oscillatory power νmax for known oscillating stars, adapted from the left panel of Fig. 2 from Huber et al. (2024). The shaded area represents the region of evolved RGB stars, with a boundary set at νmax ≲ 100 μHz. Noteworthy low-metallicity sub-giant branch (SGB) and RGB stars for which asteroseismic modelling has been performed are highlighted. Note that EPIC206443676 was modelled using the global asteroseismic parameters (Deheuvels et al. 2012), not the individual frequencies as in all other displayed cases. The red stars indicate the two giants considered in the present work.
Current usage metrics show cumulative count of Article Views (full-text article views including HTML views, PDF and ePub downloads, according to the available data) and Abstracts Views on Vision4Press platform.
Data correspond to usage on the plateform after 2015. The current usage metrics is available 48-96 hours after online publication and is updated daily on week days.
Initial download of the metrics may take a while.