Fig. 5
Download original image
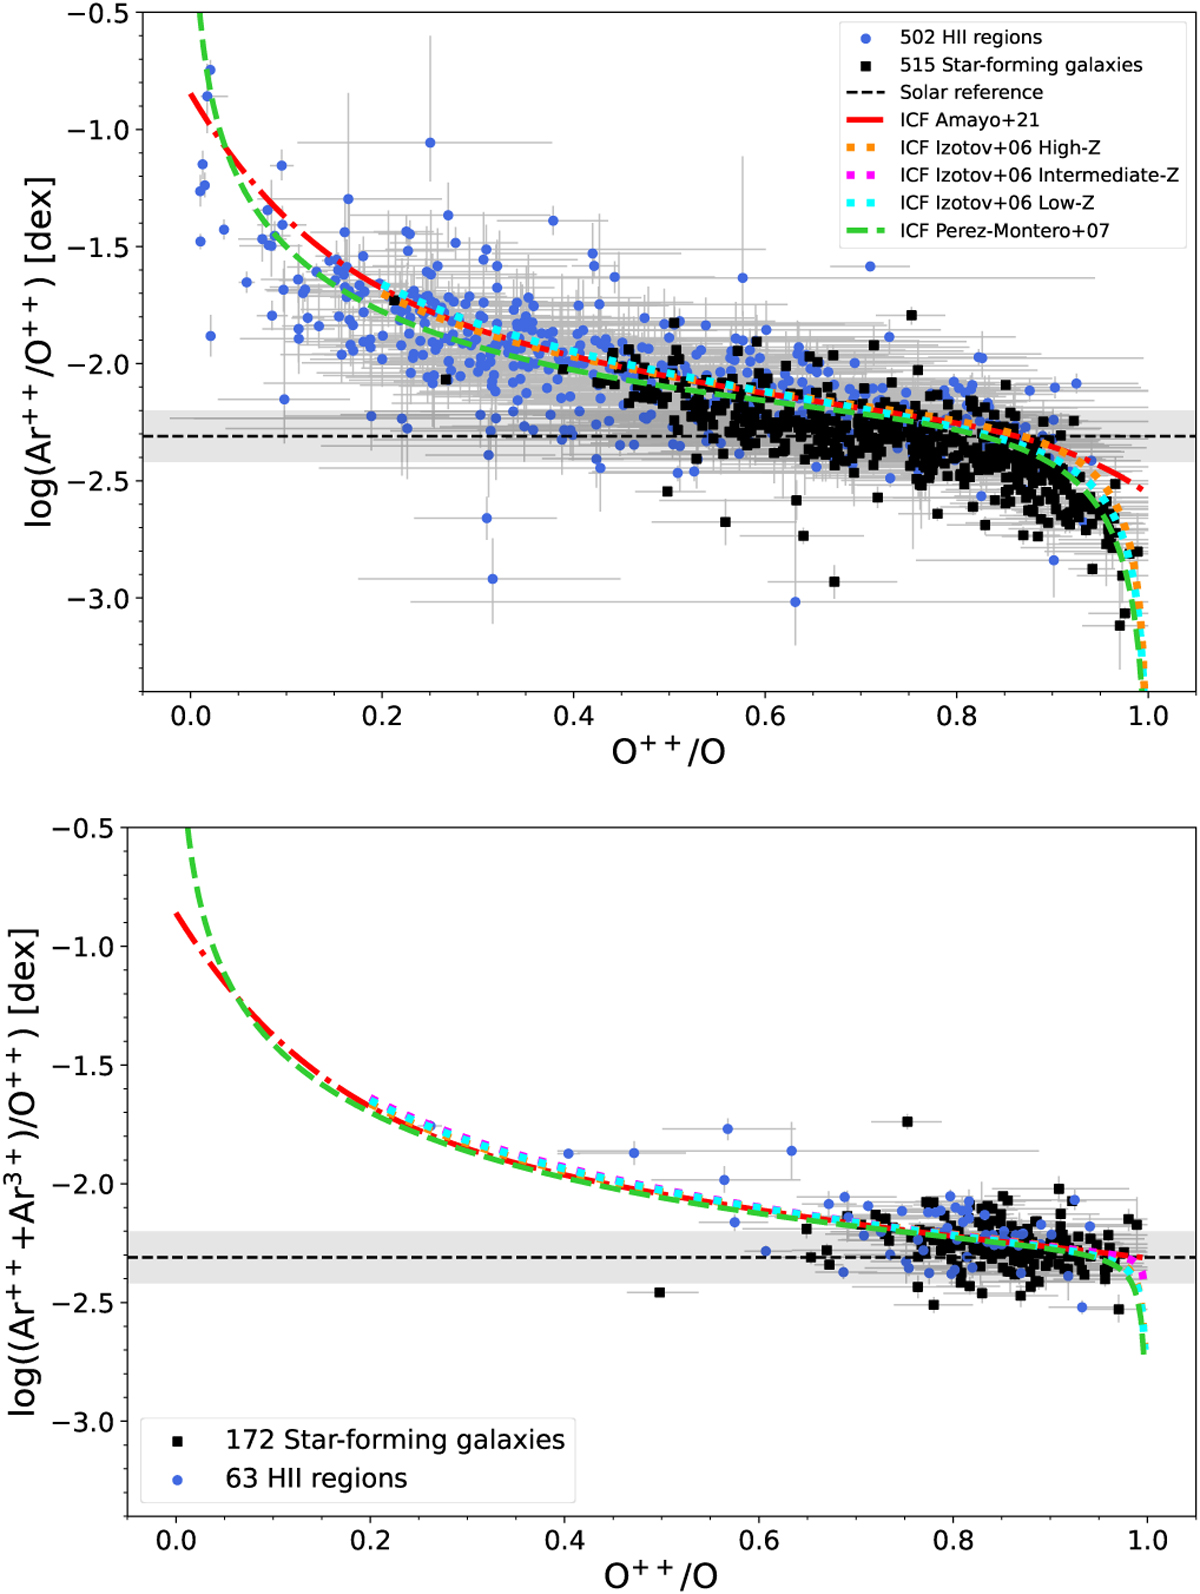
Log(Ar2+ /O2+) (top) and log((Ar2++Ar3+)/O2+) (bottom) as a function of the ionisation degree, O2+/O, for DESIRED-E sample of H II regions (blue circles) and SFGs (black squares). The black dashed lines and the grey bands show the solar log(Ar/O) value and their associated uncertainty, respectively, from Asplund et al. (2021). The different curves represent the ICF(Ar) schemes used in this study: Amayo et al. (2021, shown as red dashed-dotted lines), Izotov et al. (2006, shown as dotted lines with colours corresponding to three metallicity ranges,) and Pérez-Montero et al. (2007, shown as green dashed lines).
Current usage metrics show cumulative count of Article Views (full-text article views including HTML views, PDF and ePub downloads, according to the available data) and Abstracts Views on Vision4Press platform.
Data correspond to usage on the plateform after 2015. The current usage metrics is available 48-96 hours after online publication and is updated daily on week days.
Initial download of the metrics may take a while.