Fig. A.1
Download original image
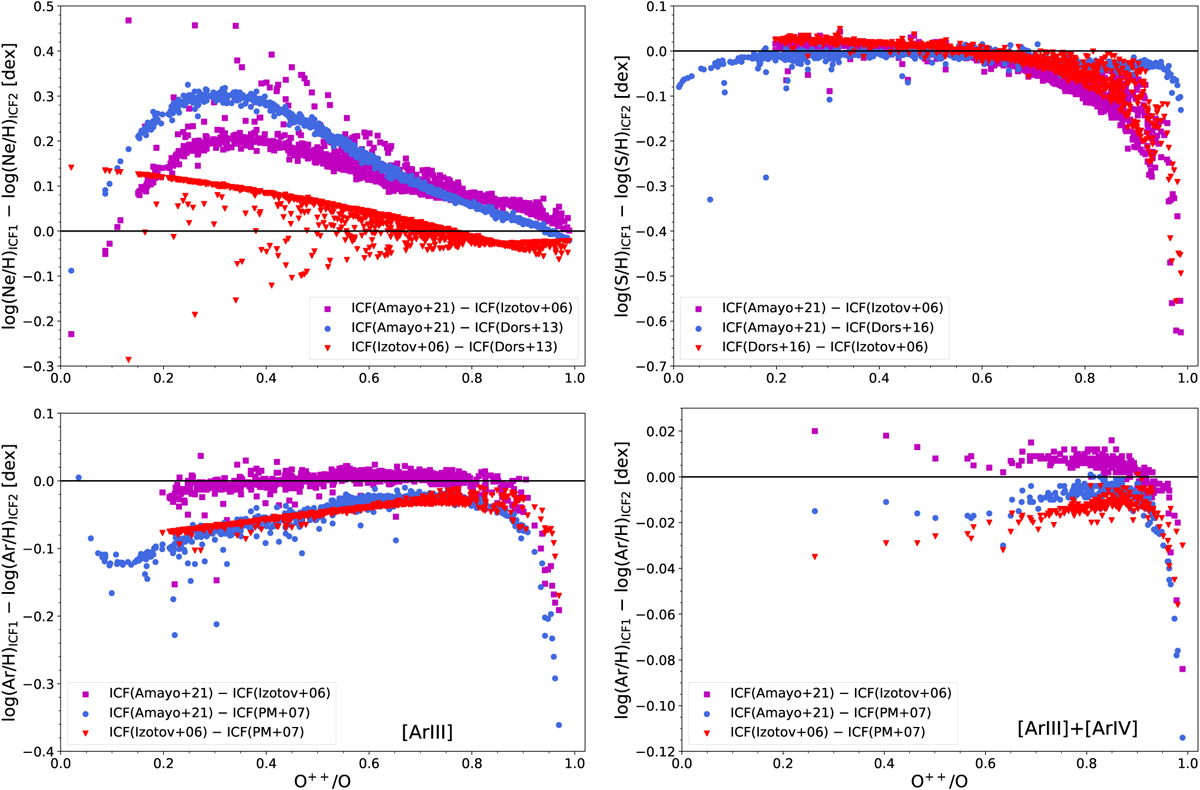
Difference of the logarithmic Ne (top left), S (top right) and Ar (bottom panels) abundances calculated from the spectra of the DESIRED-E sample using various ICF schemes. In the bottom left panel we use ICF(Ar) using only [Ar III] lines and in the bottom right panel [Ar III] and [Ar IV] lines. The different symbols represent the pairs of ICF used in each case. The horizontal black line indicates equal abundance. Amayo+21: Amayo et al. (2021); Izotov+06: Izotov et al. (2006); Dors+13: Dors et al. (2013); Dors+16: Dors et al. (2016); and PM+07: Pérez-Montero et al. (2007).
Current usage metrics show cumulative count of Article Views (full-text article views including HTML views, PDF and ePub downloads, according to the available data) and Abstracts Views on Vision4Press platform.
Data correspond to usage on the plateform after 2015. The current usage metrics is available 48-96 hours after online publication and is updated daily on week days.
Initial download of the metrics may take a while.