Fig. 11
Download original image
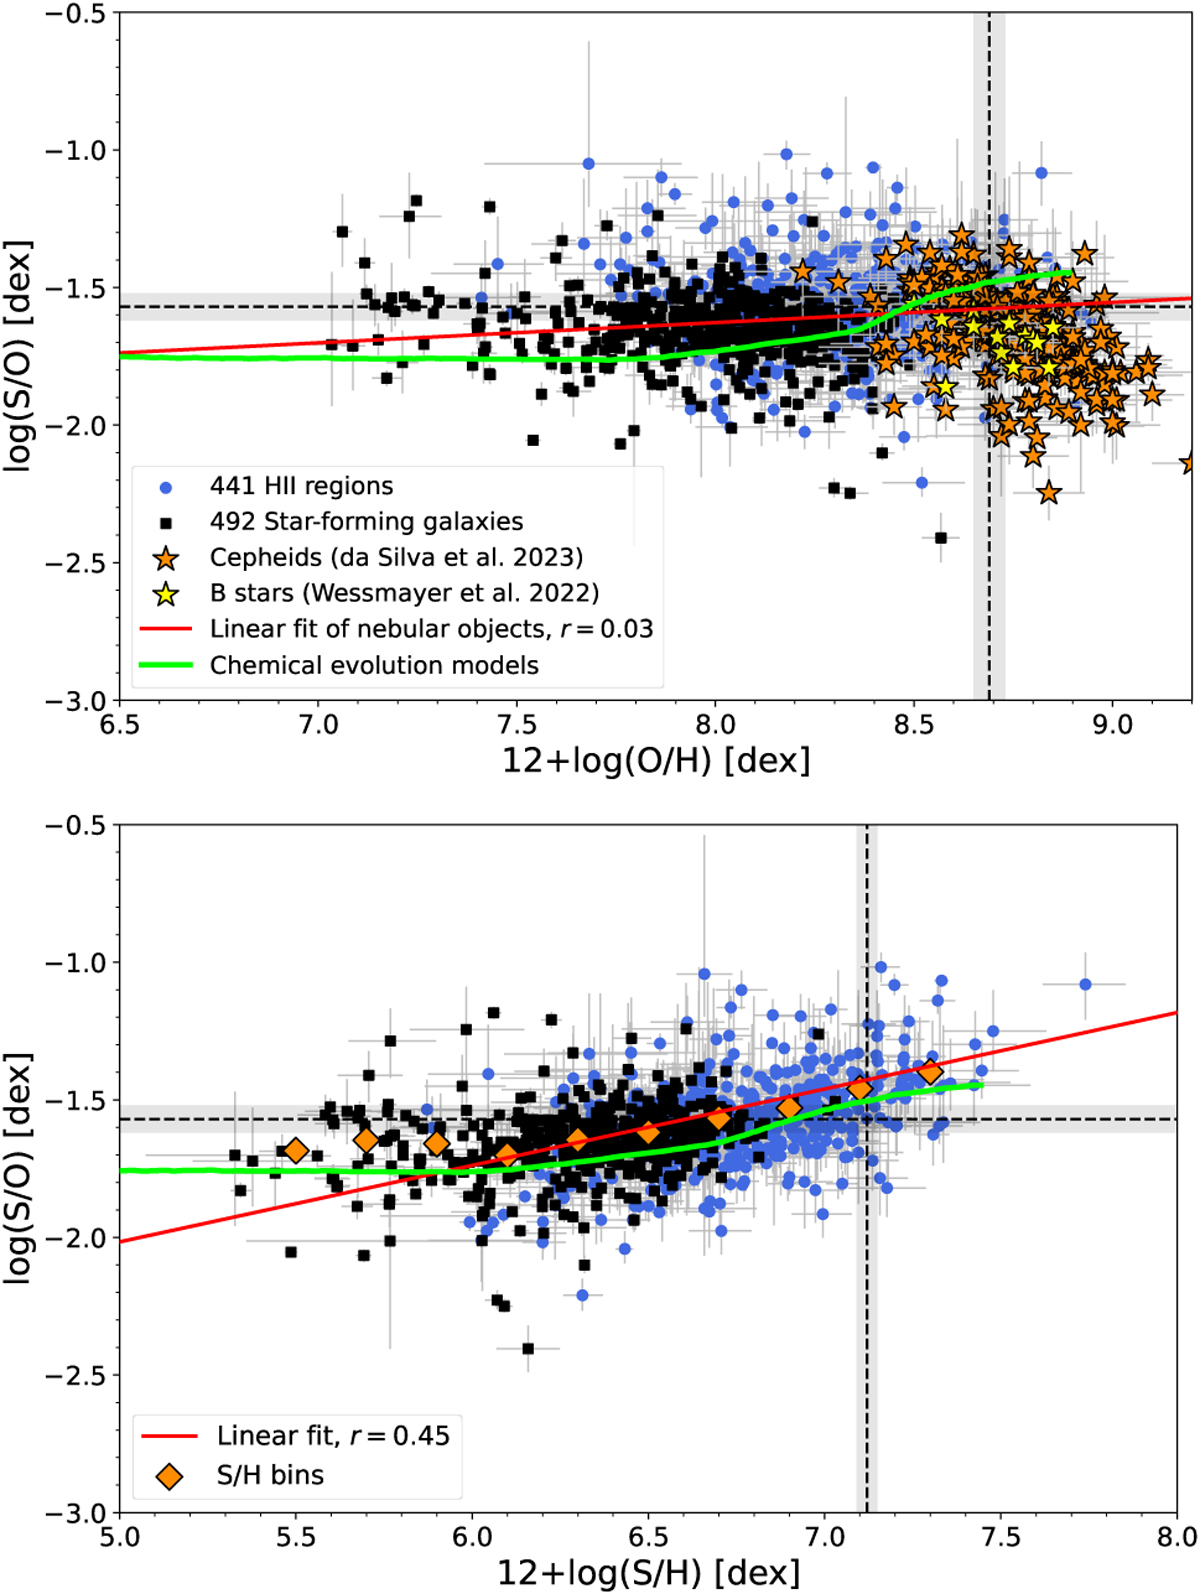
log(S/O) as a function of 12+log(O/H) (top) and as a function of 12+log(S/H) (bottom). Black squares and blue circles represent SFGs and H II regions of the DESIRED-E sample, which S/O ratios have been calculated using the ICF(S) scheme by Izotov et al. (2006). The green continuous line shows the time evolution of S and O abundances of the ISM predicted by the CEM of the Milky Way of Kobayashi et al. (2020). Yellow stars represent the abundances obtained from quantitative spectroscopic analysis of Galactic B stars by Weßmayer et al. (2022). Orange stars represent the abundances of Galactic classical Cepheids determined by da Silva et al. (2023). Orange diamonds indicate the mean log(S/O) values considering bins in 12+log(S/H). The red continuous lines represent linear fits to the data represented in each panel. The black dashed lines and the grey bands show the solar 12+log(O/H), 12+log(S/H) and log(S/O) and their associated uncertainties, respectively, from Asplund et al. (2021).
Current usage metrics show cumulative count of Article Views (full-text article views including HTML views, PDF and ePub downloads, according to the available data) and Abstracts Views on Vision4Press platform.
Data correspond to usage on the plateform after 2015. The current usage metrics is available 48-96 hours after online publication and is updated daily on week days.
Initial download of the metrics may take a while.