Fig. 10
Download original image
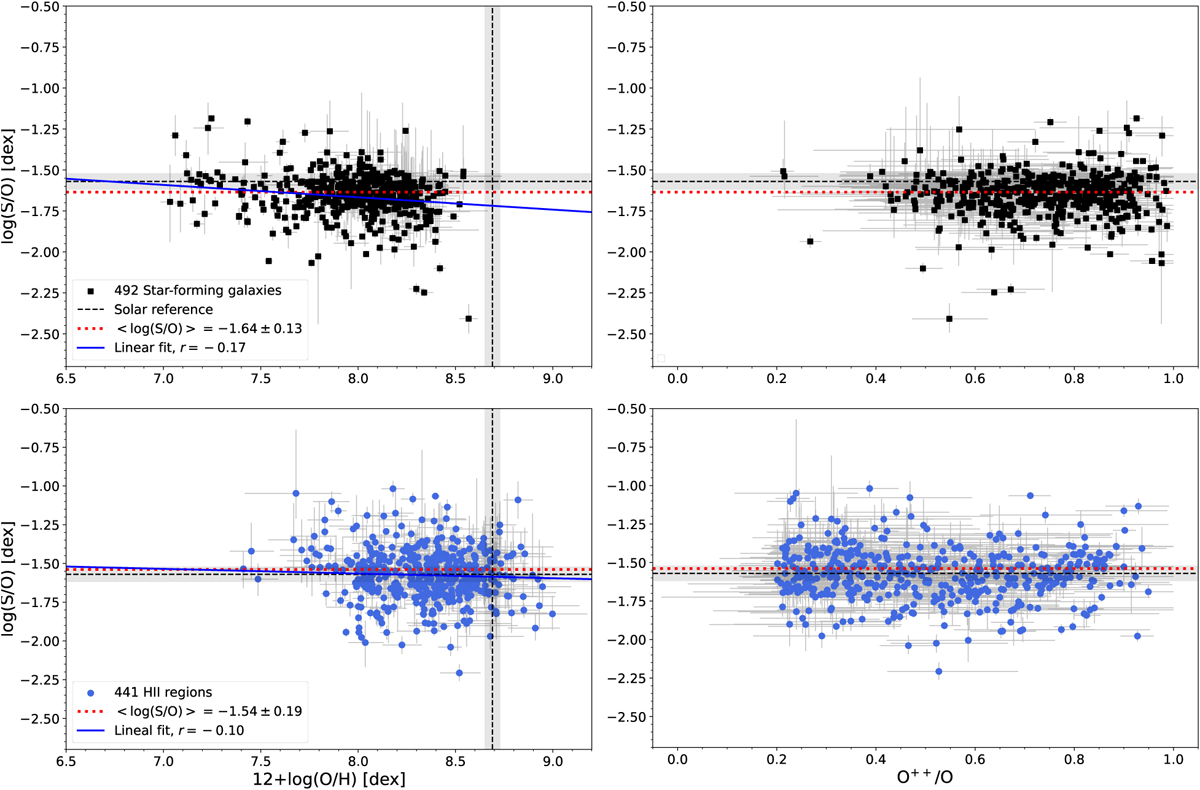
log(S/O) as a function of 12+log(O/H) (left) and the ionisation degree, O2+/O (right), for the DESIRED-E sample. The values of log(S/O) are calculated using the ICF(S) scheme by Izotov et al. (2006). The top panels show the points corresponding to SFGs (black squares) and the bottom panels the corresponding to H II regions (blue circles). The dotted red line represents the mean value of the log(S/O) obtained for each kind of object. The blue continuous lines represent linear fits to the data represented in each panel of the left column. The black dashed lines and the grey bands show the solar 12+log(O/H) and log(S/O) and their associated uncertainties, respectively, from Asplund et al. (2021).
Current usage metrics show cumulative count of Article Views (full-text article views including HTML views, PDF and ePub downloads, according to the available data) and Abstracts Views on Vision4Press platform.
Data correspond to usage on the plateform after 2015. The current usage metrics is available 48-96 hours after online publication and is updated daily on week days.
Initial download of the metrics may take a while.