Fig. 7
Download original image
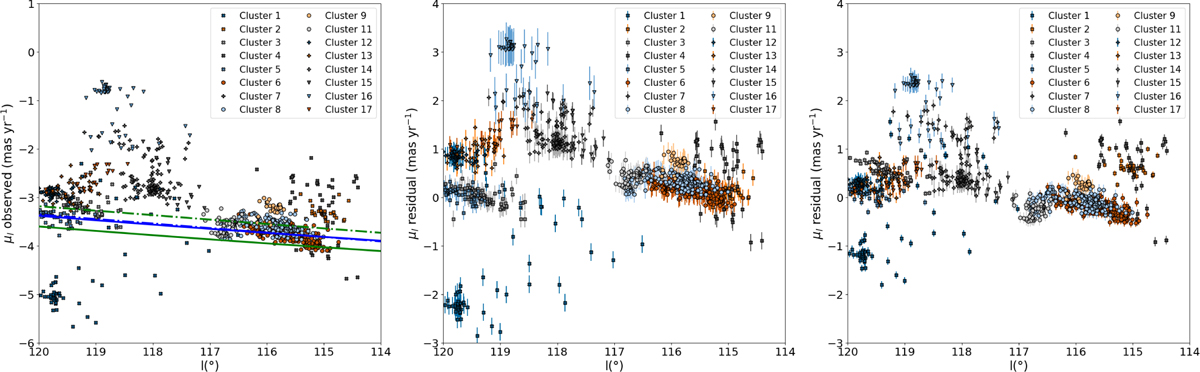
Galactic longitude as a function of proper motions in Galactic longitude for our 17 identified clusters. The left panel shows observed PMs, with the blue and green lines respectively representing the rotation curves at a distance of 2.5 and 3 kpc (from Bovy 2017 as solid lines and from Eilers et al. 2019 as dash-dotted lines). The middle panel displays the residual PMs after subtraction from the Galactic rotation models by Bovy (2017), and the right panel is identical but uses the model from Eilers et al. (2019).
Current usage metrics show cumulative count of Article Views (full-text article views including HTML views, PDF and ePub downloads, according to the available data) and Abstracts Views on Vision4Press platform.
Data correspond to usage on the plateform after 2015. The current usage metrics is available 48-96 hours after online publication and is updated daily on week days.
Initial download of the metrics may take a while.