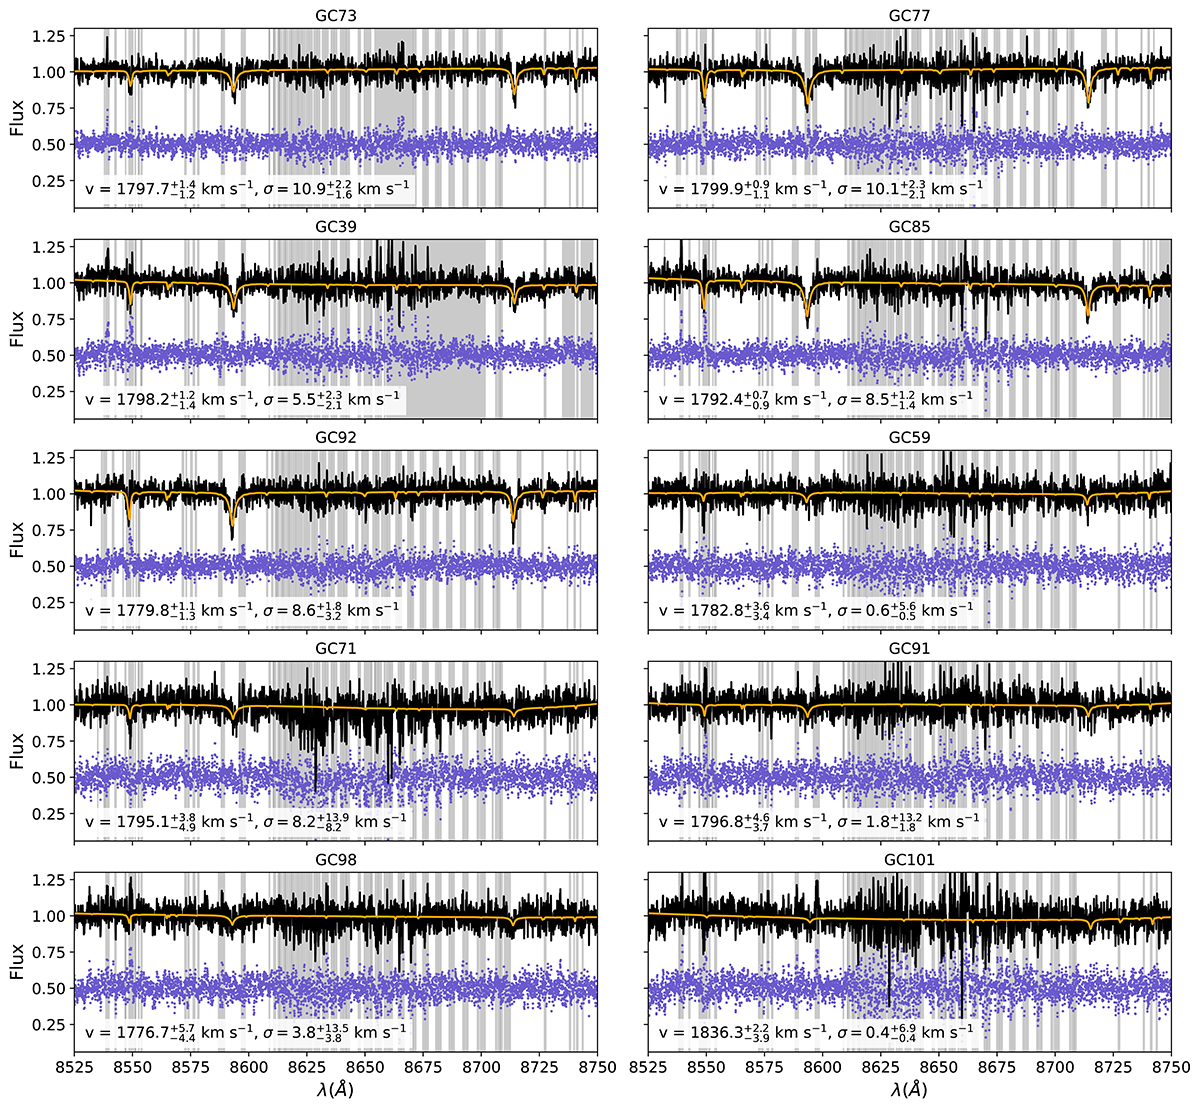
Fig. A.1.
Download original image
PPXF fits for the GC sample. GIRAFFE spectra are shown in black, the optimal model template in orange, and residuals of the fit are shown underneath in purple. The greyed-out areas are regions of strong sky residuals which are masked out in the fitting procedure. Radial velocities and velocity dispersions are shown for each corresponding GC. Velocity dispersion values less than ∼4 km/s are below the resolution limit of our analysis and therefore unreliable.
Current usage metrics show cumulative count of Article Views (full-text article views including HTML views, PDF and ePub downloads, according to the available data) and Abstracts Views on Vision4Press platform.
Data correspond to usage on the plateform after 2015. The current usage metrics is available 48-96 hours after online publication and is updated daily on week days.
Initial download of the metrics may take a while.