Fig. 3.
Download original image
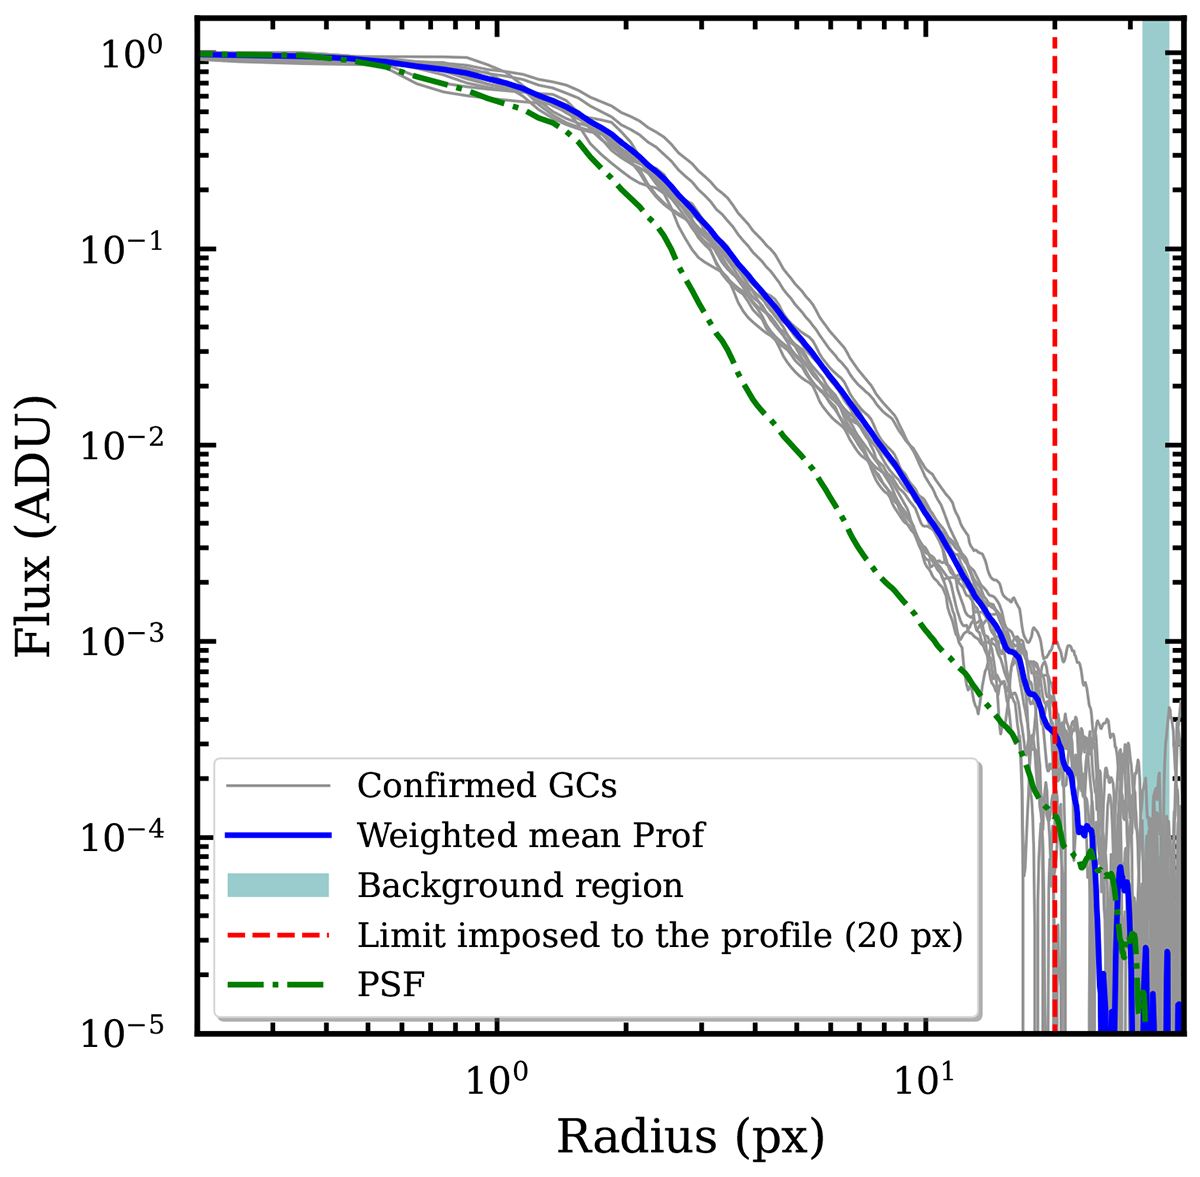
GC profiles from HST/ACS F606W imaging for the 12 spectroscopically confirmed GCs from Trujillo et al. (2019, grey), the S/N-weighted mean profile of the GCs (blue line), and the mean profile of a star in the images (green). Additionally the vertical dashed red line indicates where the profile is cut and the light blue region indicates where the background has been estimated. The GCs are clearly more extended than the PSF.
Current usage metrics show cumulative count of Article Views (full-text article views including HTML views, PDF and ePub downloads, according to the available data) and Abstracts Views on Vision4Press platform.
Data correspond to usage on the plateform after 2015. The current usage metrics is available 48-96 hours after online publication and is updated daily on week days.
Initial download of the metrics may take a while.