Fig. 1.
Download original image
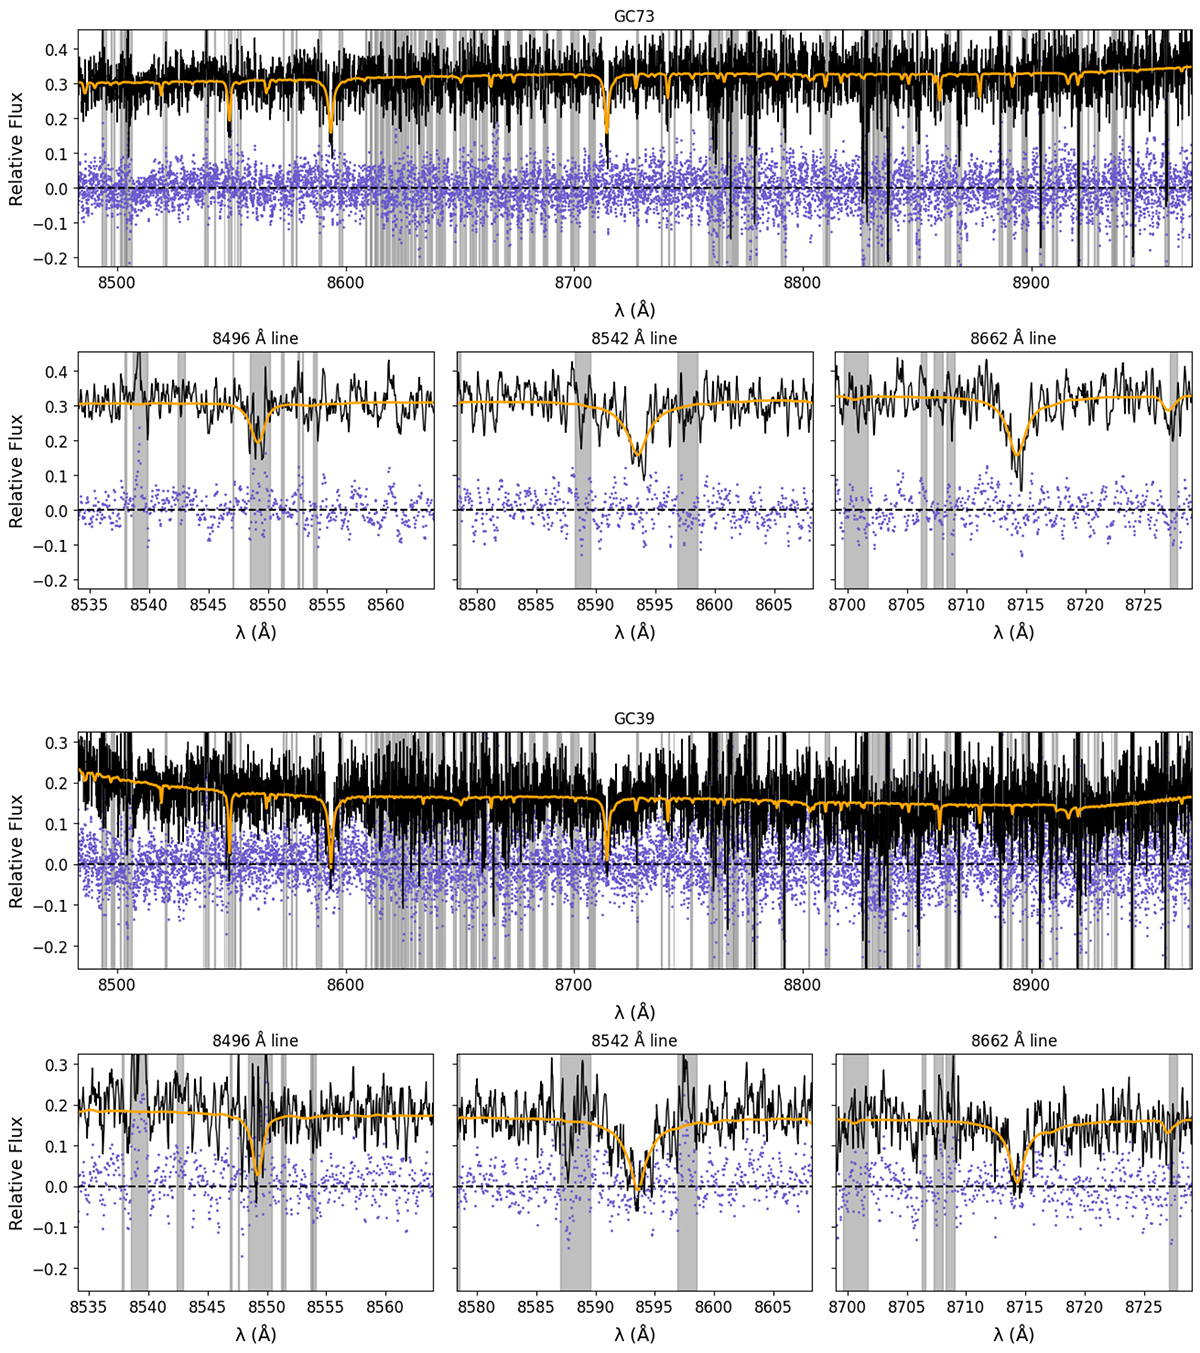
Example PPXF fits for two GCs for which we measure velocity dispersions (top GC73, bottom GC39). The FLAMES GIRAFFE spectra are shown in black, the optimal model template in orange and residuals of the fit are shown underneath in blue. The greyed out areas are regions of strong sky residuals which are masked out in the fitting procedure. The zoom-in regions are centred around the three lines of the calcium triplet. The first line of the calcium triplet (at ∼ 8549 Å) is strongly affected by a sky residual. Fits to all the spectra are shown in Fig. A.1.
Current usage metrics show cumulative count of Article Views (full-text article views including HTML views, PDF and ePub downloads, according to the available data) and Abstracts Views on Vision4Press platform.
Data correspond to usage on the plateform after 2015. The current usage metrics is available 48-96 hours after online publication and is updated daily on week days.
Initial download of the metrics may take a while.