Open Access
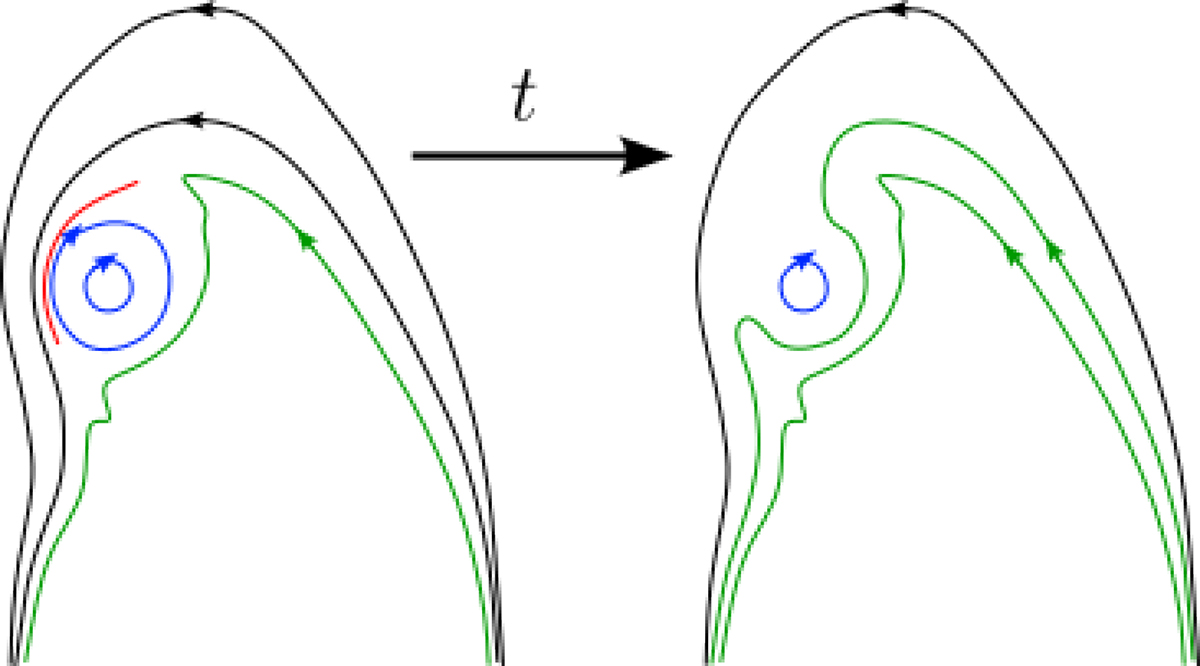
Fig. 5.
Download original image
Diagram illustrating later magnetic reconnection occurring in cases 2, 3, 5, and 6. Black lines represent the magnetic field lines of the MC, blue lines the magnetic field lines of the MFR, and green lines the arcade below the MFR. The red line highlights the current sheet region between the MFR and the MC.
Current usage metrics show cumulative count of Article Views (full-text article views including HTML views, PDF and ePub downloads, according to the available data) and Abstracts Views on Vision4Press platform.
Data correspond to usage on the plateform after 2015. The current usage metrics is available 48-96 hours after online publication and is updated daily on week days.
Initial download of the metrics may take a while.