Fig. 3.
Download original image
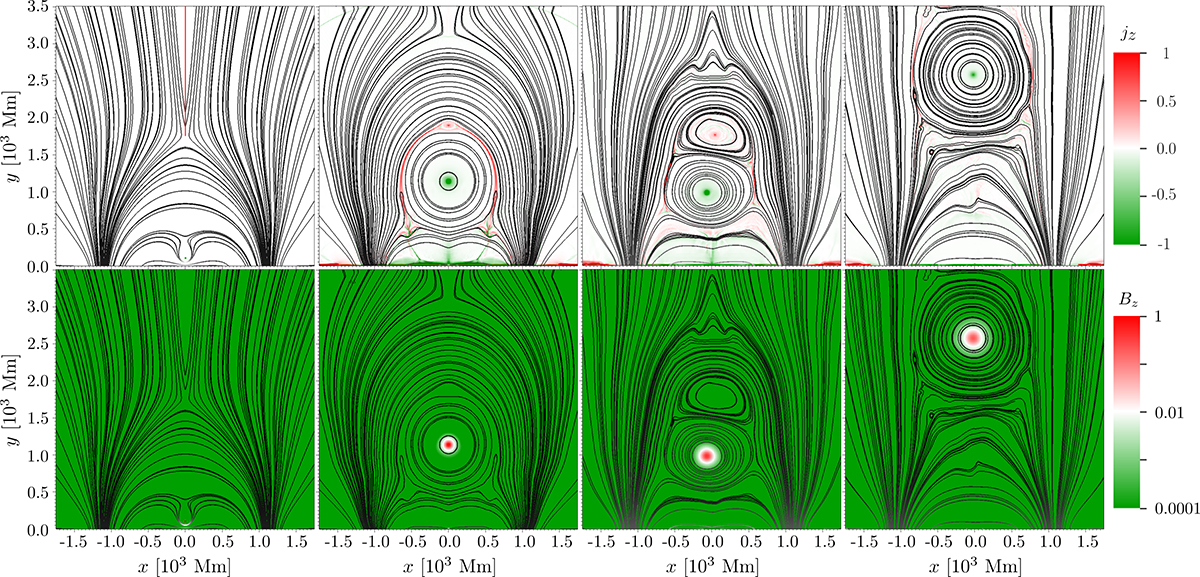
Upper panel: Evolution of the current jz (in units of 10−10 G cm−1) for case 1. Bottom panel: Evolution of Bz (in units of G) within the MFR. The initial time is depicted in the first panel, t = 5000 s in second panel, t = 16 000 s in third panel, and t = 17 000 s in the last panel. The black lines represent the projection of the magnetic field lines into the xy-plane. An associated movie is available online.
Current usage metrics show cumulative count of Article Views (full-text article views including HTML views, PDF and ePub downloads, according to the available data) and Abstracts Views on Vision4Press platform.
Data correspond to usage on the plateform after 2015. The current usage metrics is available 48-96 hours after online publication and is updated daily on week days.
Initial download of the metrics may take a while.