Fig. 9
Download original image
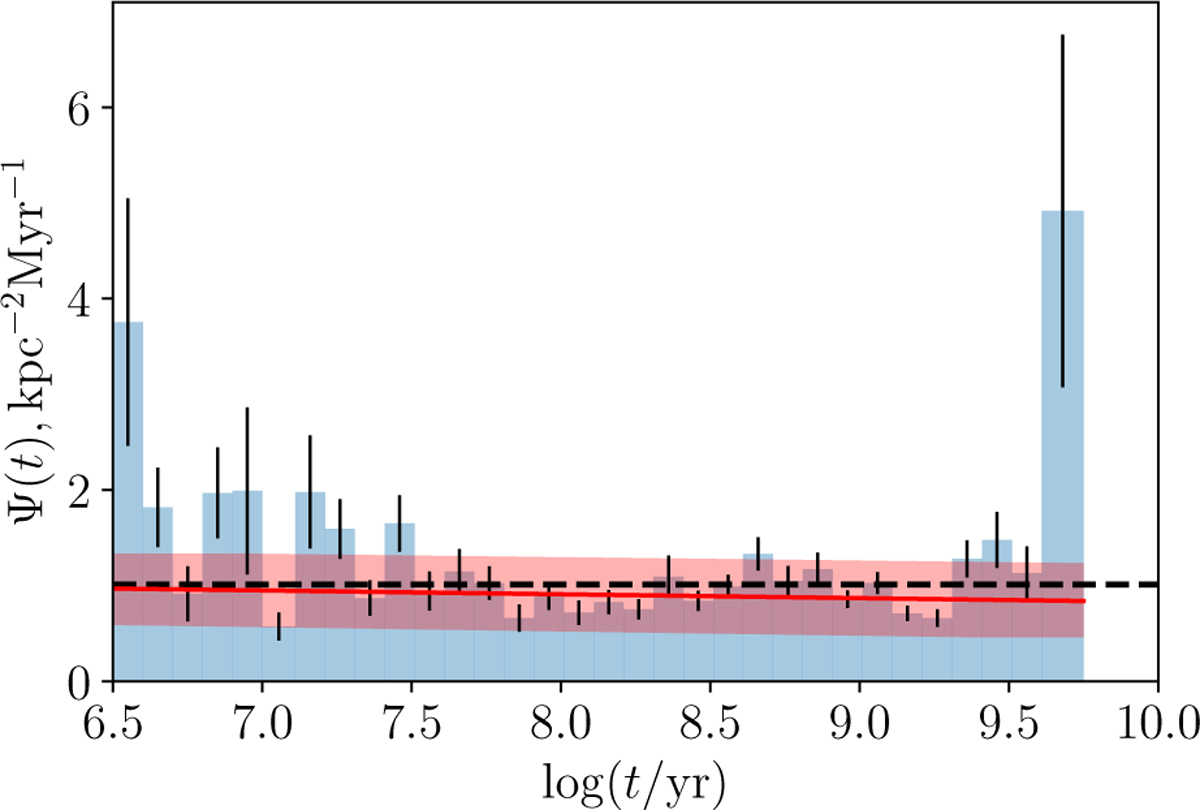
CFR reconstructed from the cluster sample using CIMF and lifetime-mass relation of the best-fitting model. Error bars represent uncertainties from Poisson noise. The solid red line represents a linear fit of the CFR, with the shaded area giving the uncertainty of the fit. The horizontal dashed line gives the constant CFR of the model.
Current usage metrics show cumulative count of Article Views (full-text article views including HTML views, PDF and ePub downloads, according to the available data) and Abstracts Views on Vision4Press platform.
Data correspond to usage on the plateform after 2015. The current usage metrics is available 48-96 hours after online publication and is updated daily on week days.
Initial download of the metrics may take a while.