Fig. 6
Download original image
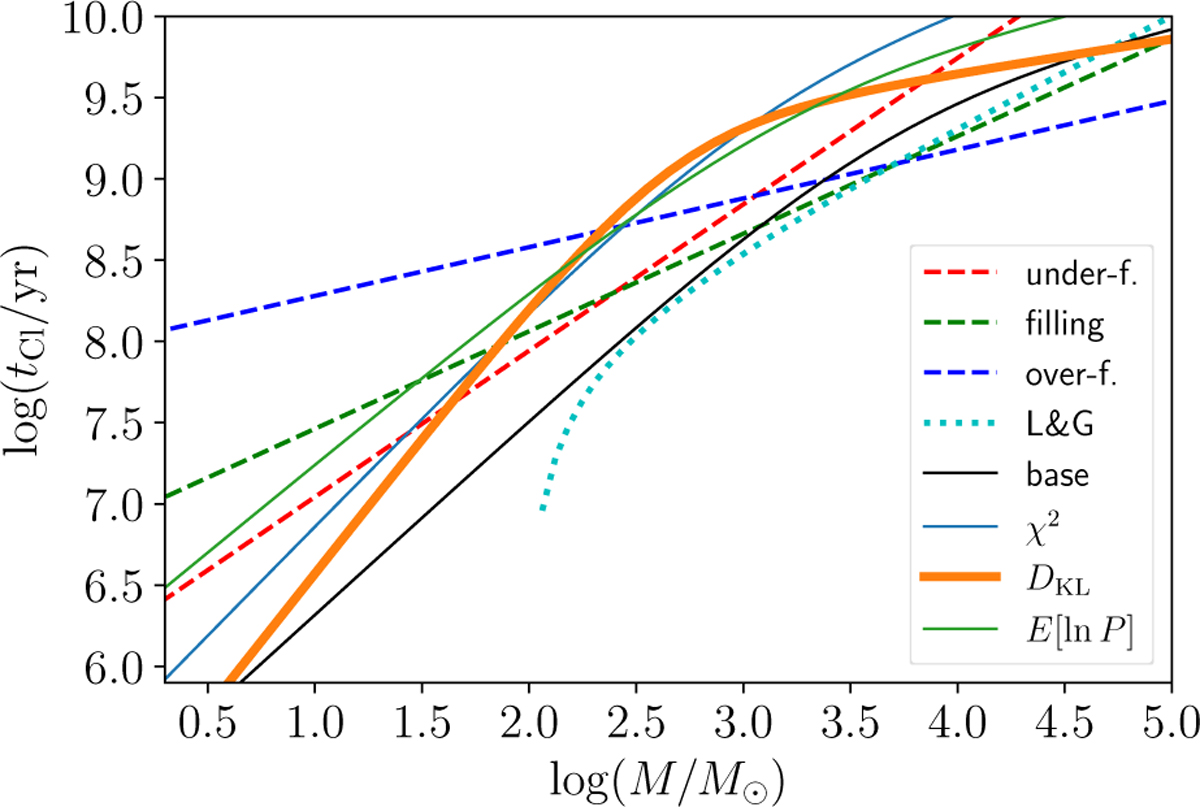
Comparison of cluster lifetime-mass relations. Our models are shown as solid lines, in particular the base model as well as the best χ2-fit, DKL-fit and E[ln P]-fit models. The bold solid line corresponds to the best model. Dashed lines correspond to Piskunov et al. (2018) lifetimes, which follow parametrisations found by Ernst et al. (2015) for Roche volume under-filling, filling and over-filling clusters. The dotted line corresponds to the mass loss model of Lamers & Gieles (2006) for 100 M⊙ remnant clusters.
Current usage metrics show cumulative count of Article Views (full-text article views including HTML views, PDF and ePub downloads, according to the available data) and Abstracts Views on Vision4Press platform.
Data correspond to usage on the plateform after 2015. The current usage metrics is available 48-96 hours after online publication and is updated daily on week days.
Initial download of the metrics may take a while.