Fig. 4
Download original image
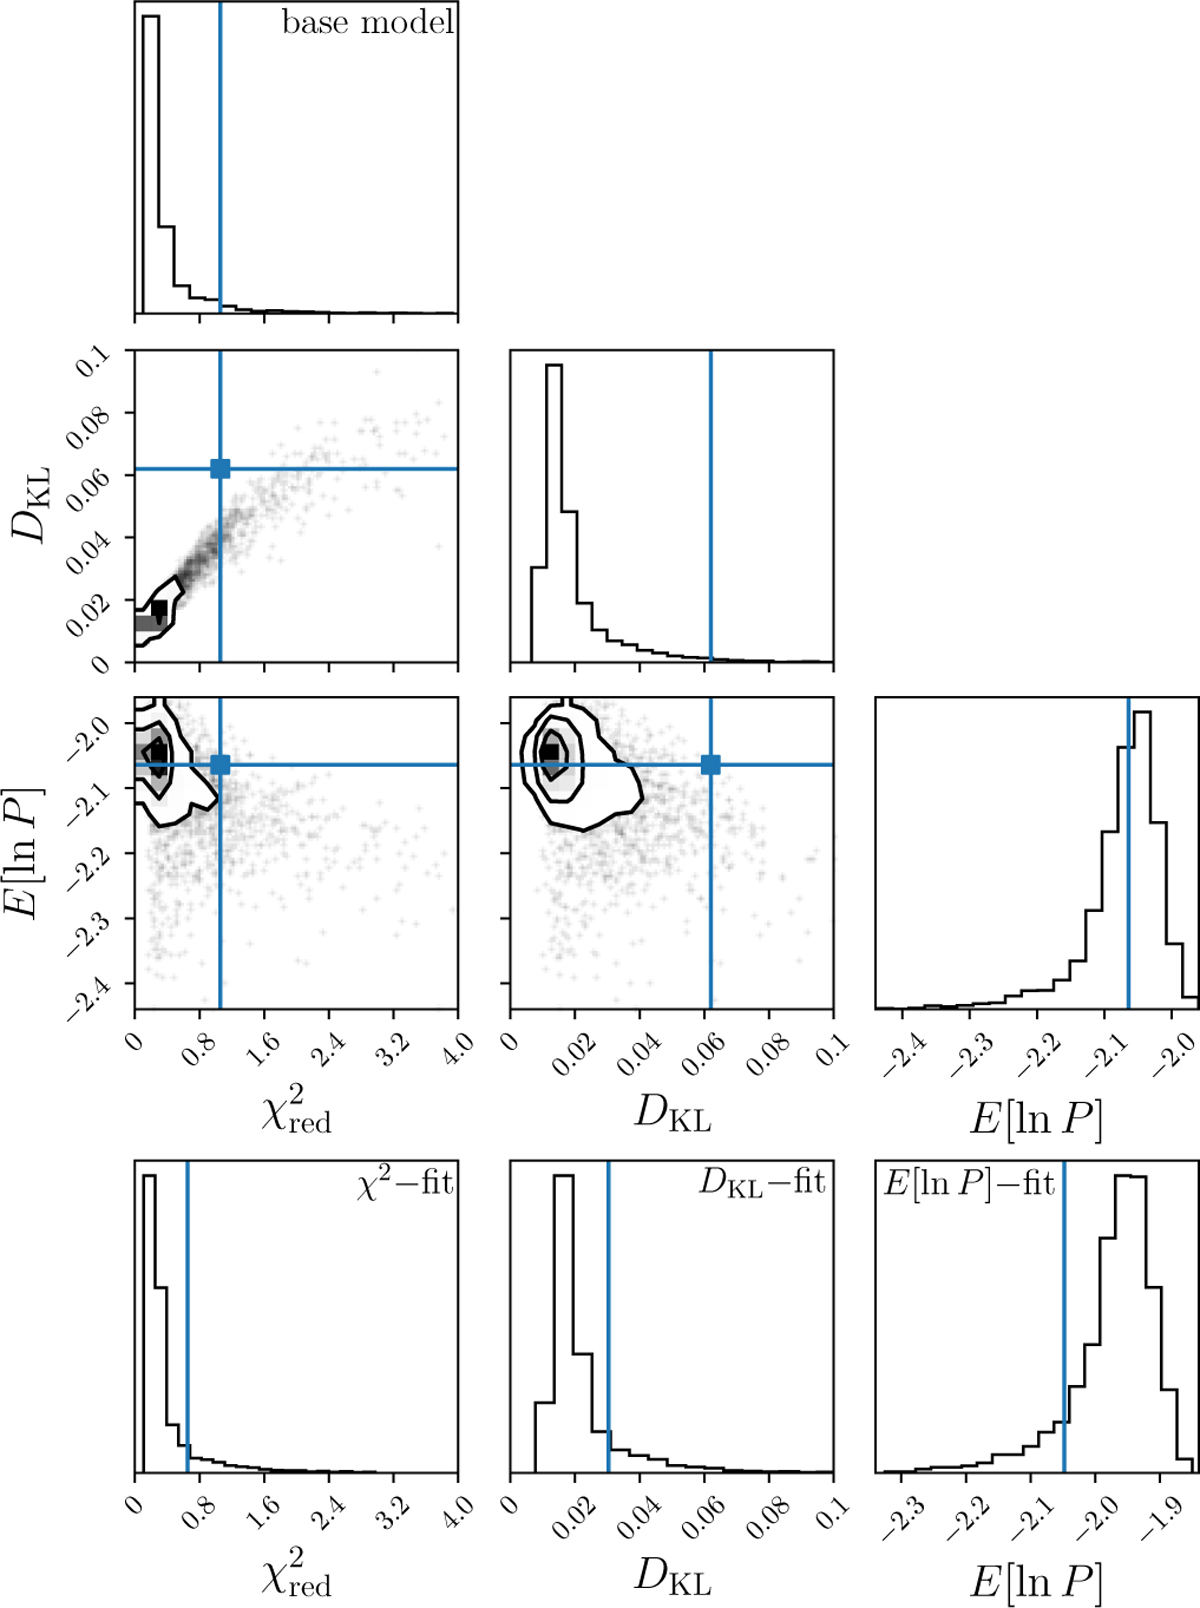
Distribution of the different fit statistics for synthetic cluster samples. From left to right, the columns correspond to ![]() , DKL, and E[ln P], respectively. The three topmost rows show the distribution for the base model, including binned 2D distributions. The contour lines enclose 11.8%, 39.3%, 67.5% and 86.4% of samples. This corresponds to levels of 0.5σ, 1σ, 1.5σ, and 2σ for a 2D Gaussian. Samples outside the contours are drawn as individual dots. The bottom row contains histograms for samples of the χ2-fit, DKL-fit, and E[ln P]-fit models. The blue lines mark the values of the fit statistics for the observed sample listed in Table 5.
, DKL, and E[ln P], respectively. The three topmost rows show the distribution for the base model, including binned 2D distributions. The contour lines enclose 11.8%, 39.3%, 67.5% and 86.4% of samples. This corresponds to levels of 0.5σ, 1σ, 1.5σ, and 2σ for a 2D Gaussian. Samples outside the contours are drawn as individual dots. The bottom row contains histograms for samples of the χ2-fit, DKL-fit, and E[ln P]-fit models. The blue lines mark the values of the fit statistics for the observed sample listed in Table 5.
Current usage metrics show cumulative count of Article Views (full-text article views including HTML views, PDF and ePub downloads, according to the available data) and Abstracts Views on Vision4Press platform.
Data correspond to usage on the plateform after 2015. The current usage metrics is available 48-96 hours after online publication and is updated daily on week days.
Initial download of the metrics may take a while.