Fig. 2
Download original image
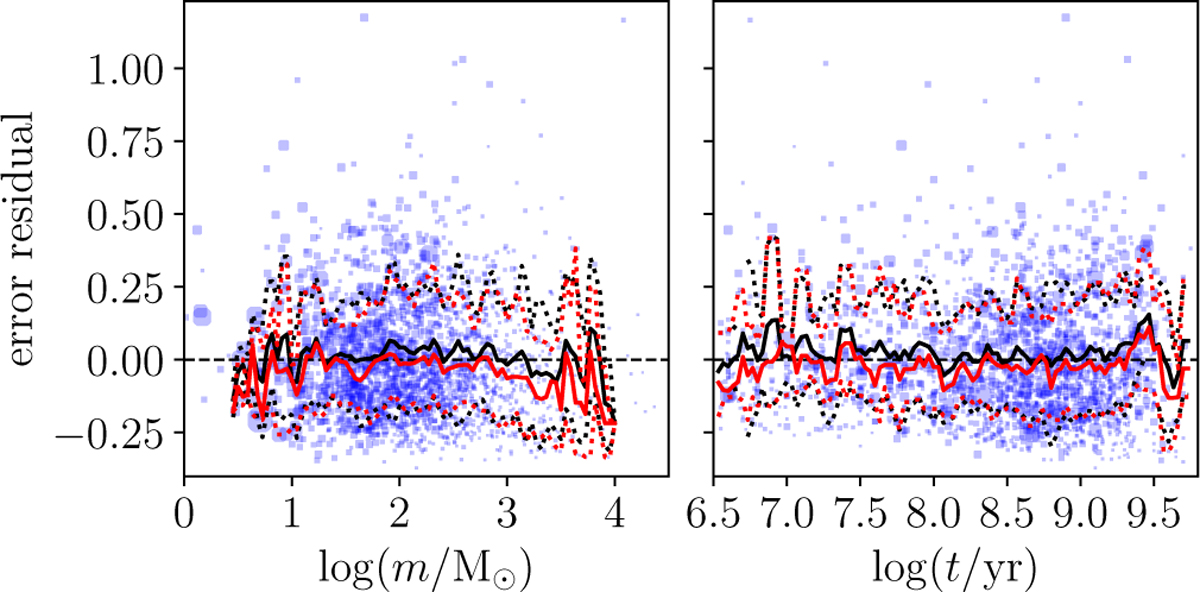
Error residuals δµ,i −δµ(μ, τ) (circles) as functions of cluster mass (left panel) and age (right panel). The size of the circles is proportional to the clusters’ contributions to the total surface density. Mean and median of the residuals (solid red and black lines, respectively) were computed using a sliding window of width 0.1 dex. Dotted lines in red and black denote the corresponding intervals enclosing one standard deviation and the 16th to 84th percentile, respectively. We note that a single outlying cluster with δµ > 2.5 lies beyond the y-axis range and is not shown.
Current usage metrics show cumulative count of Article Views (full-text article views including HTML views, PDF and ePub downloads, according to the available data) and Abstracts Views on Vision4Press platform.
Data correspond to usage on the plateform after 2015. The current usage metrics is available 48-96 hours after online publication and is updated daily on week days.
Initial download of the metrics may take a while.