Open Access
Fig. B.1
Download original image
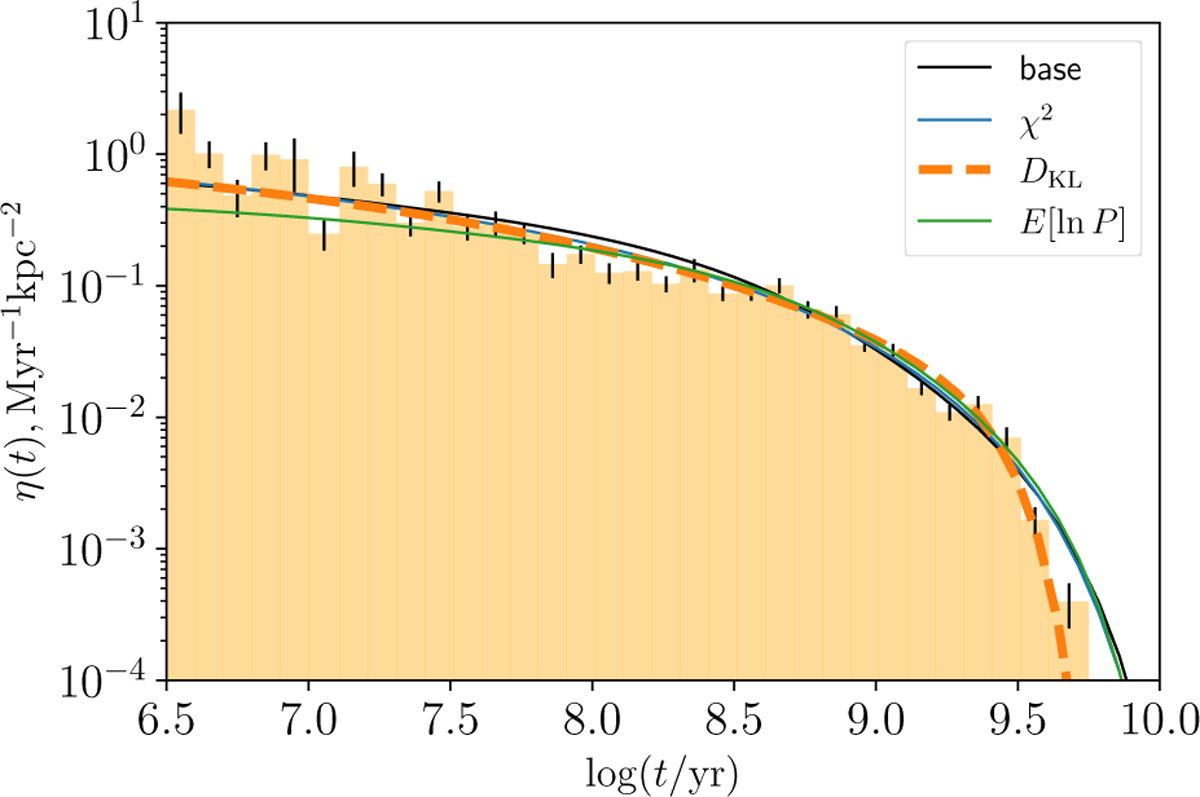
Observed and modelled CAFs. The histogram shows the observed CAF, error bars represent observational uncertainty from Poisson noise. Modelled CAFs are plotted for the base model, the χ2-fit, the DKL-fit, and the E[ln P]-fit model. The bold dashed line corresponds to the best model.
Current usage metrics show cumulative count of Article Views (full-text article views including HTML views, PDF and ePub downloads, according to the available data) and Abstracts Views on Vision4Press platform.
Data correspond to usage on the plateform after 2015. The current usage metrics is available 48-96 hours after online publication and is updated daily on week days.
Initial download of the metrics may take a while.