Fig. 12
Download original image
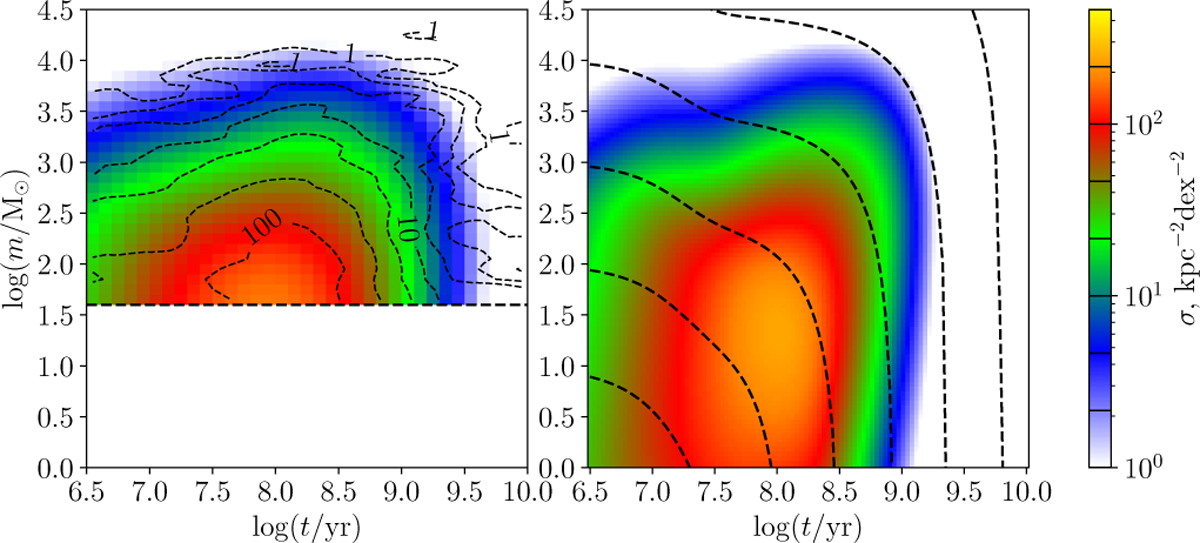
Modelled CAMF for the fit to Hunt & Reffert (2023, 2024) data. In the right panel, the model CAMF with no smoothing is shown. Dashed lines are mass loss tracks corresponding to initial masses of 1 M⊙, 10 M⊙, 102 M⊙, 103 M⊙, 104 M⊙, 105 M⊙, and 106 M⊙. In the left panel, the contours of the smoothed observed CAMF are plotted over the error-smoothed model CAMF. Contour levels of the smoothed data are marked with solid lines on the colour scale bar.
Current usage metrics show cumulative count of Article Views (full-text article views including HTML views, PDF and ePub downloads, according to the available data) and Abstracts Views on Vision4Press platform.
Data correspond to usage on the plateform after 2015. The current usage metrics is available 48-96 hours after online publication and is updated daily on week days.
Initial download of the metrics may take a while.